Counties with the highest unemployment in Kentucky
Published 5:41 pm Friday, March 15, 2024
Counties with the highest unemployment in Kentucky
While today’s unemployment rates are significantly lower than the COVID-19 pandemic peak of 14.7% experienced in April 2020, the fear of job losses remains as workers stare down an uncertain economic future.
Stacker compiled a list of counties with the highest unemployment rates in Kentucky using Bureau of Labor Statistics data. Counties are ranked by their preliminary unemployment rate in January 2024, with initial ties broken by the number of unemployed people within that county, though some ties may remain. County unemployment rates are released about a month behind the national numbers. County-level unemployment rates are not seasonally adjusted.
Experts are mixed in their views of a potential recession. The return of student loan payments, continually high gas prices, persistent inflation, and insurance price escalations are just a few of the factors that could limit consumer spending and potentially prompt another recession. The last economic recession before the pandemic—the Great Recession of 2007-09—sent unemployment rates up to 10% as of October 2009, and a full recovery took years.
But as of February 2024, the national unemployment rate remains relatively low at 3.9%—up slightly from the previous month. Regional and state employment varies widely depending on local economies. Seasonally adjusted unemployment rates by state demonstrate a rather sizable spectrum, ranging from just 1.9% in North Dakota to 5.3% in Nevada.
![]()

Maxine Livingston // Shutterstock
#50. Estill County
– January unemployment rate (preliminary): 5.6%
— 1-month change: Up 0.9 percentage points
— 1-year change: Up 0.8 percentage points
– Total labor force: 5,080 people (284 unemployed)

Patrick Jennings // Shutterstock
#49. Rockcastle County
– January unemployment rate (preliminary): 5.6%
— 1-month change: Up 1.4 percentage points
— 1-year change: Up 0.7 percentage points
– Total labor force: 6,478 people (366 unemployed)

Canva
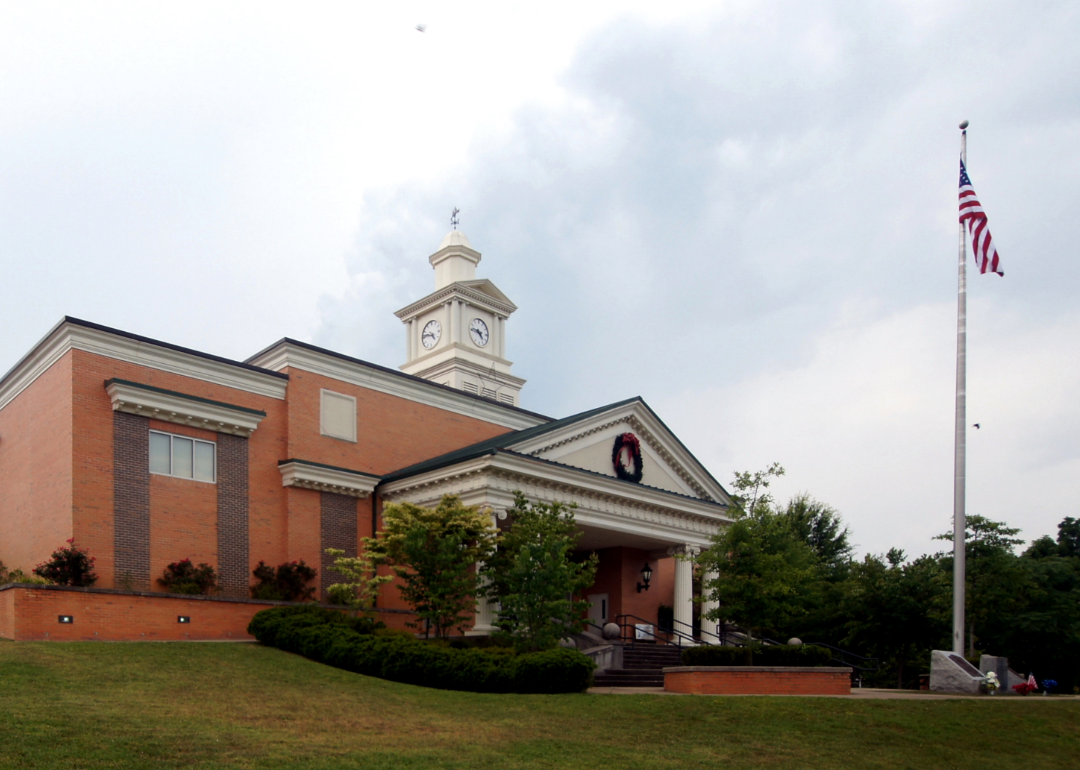
#48. Adair County
– January unemployment rate (preliminary): 5.6%
— 1-month change: Up 0.9 percentage points
— 1-year change: Up 0.3 percentage points
– Total labor force: 7,272 people (410 unemployed)
Canva
#47. Metcalfe County
– January unemployment rate (preliminary): 5.7%
— 1-month change: Up 1.2 percentage points
— 1-year change: Up 0.9 percentage points
– Total labor force: 3,881 people (222 unemployed)

Wangkun Jia // Shutterstock
#46. Edmonson County
– January unemployment rate (preliminary): 5.7%
— 1-month change: Up 1.1 percentage points
— 1-year change: Up 0.5 percentage points
– Total labor force: 4,796 people (274 unemployed)

Canva
#45. Trigg County
– January unemployment rate (preliminary): 5.7%
— 1-month change: Up 1.5 percentage points
— 1-year change: Up 0.6 percentage points
– Total labor force: 6,019 people (342 unemployed)

Michele Korfhage // Shutterstock
#44. Grayson County
– January unemployment rate (preliminary): 5.7%
— 1-month change: Up 1.5 percentage points
— 1-year change: Up 1.0 percentage points
– Total labor force: 10,295 people (584 unemployed)

Canva
#43. Lincoln County
– January unemployment rate (preliminary): 5.9%
— 1-month change: Up 1.2 percentage points
— 1-year change: Up 0.5 percentage points
– Total labor force: 9,200 people (545 unemployed)

Canva
#42. Pulaski County
– January unemployment rate (preliminary): 5.9%
— 1-month change: Up 1.2 percentage points
— 1-year change: Up 1.0 percentage points
– Total labor force: 25,063 people (1,467 unemployed)

Canva
#41. Clinton County
– January unemployment rate (preliminary): 6.0%
— 1-month change: Up 1.3 percentage points
— 1-year change: Up 0.6 percentage points
– Total labor force: 3,389 people (204 unemployed)
Canva
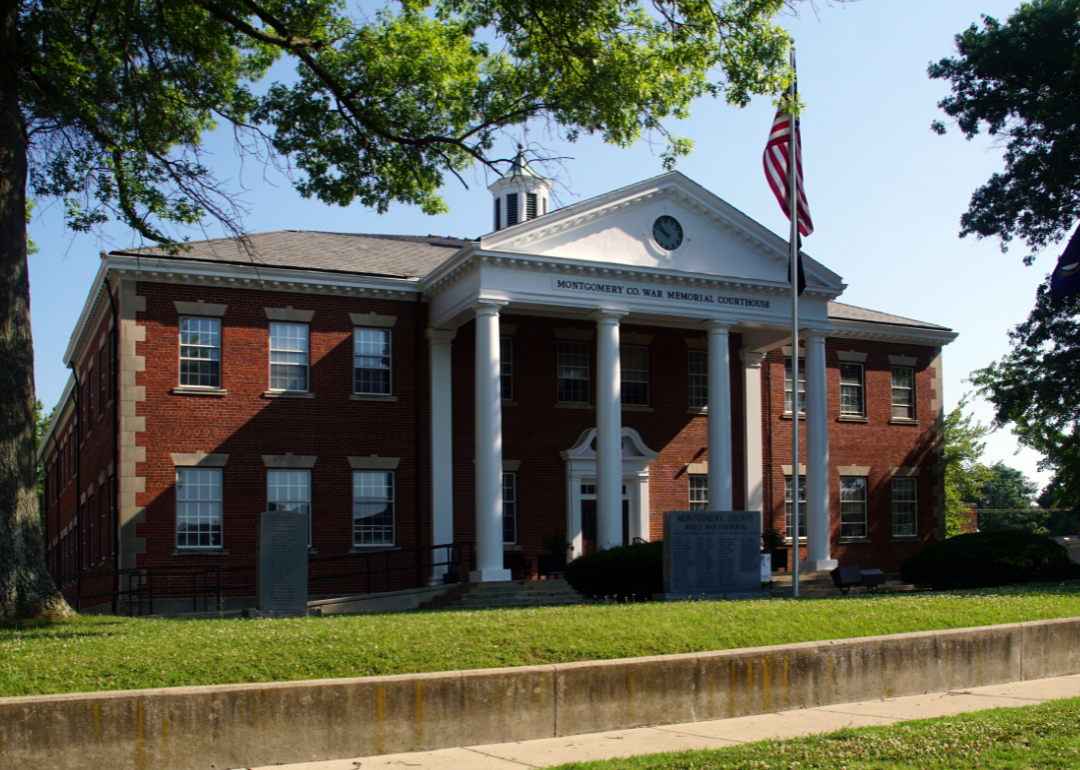
#40. Montgomery County
– January unemployment rate (preliminary): 6.0%
— 1-month change: Up 1.7 percentage points
— 1-year change: Up 1.1 percentage points
– Total labor force: 11,506 people (685 unemployed)

Jill Lang // Shutterstock
#39. Wayne County
– January unemployment rate (preliminary): 6.1%
— 1-month change: Up 1.1 percentage points
— 1-year change: Up 0.7 percentage points
– Total labor force: 6,932 people (426 unemployed)

ScottymanPhoto // Shutterstock
#38. Rowan County
– January unemployment rate (preliminary): 6.1%
— 1-month change: Up 0.8 percentage points
— 1-year change: Up 1.0 percentage points
– Total labor force: 10,086 people (615 unemployed)

Patrick Jennings // Shutterstock
#37. Fleming County
– January unemployment rate (preliminary): 6.2%
— 1-month change: Up 1.6 percentage points
— 1-year change: Up 1.3 percentage points
– Total labor force: 6,030 people (373 unemployed)

Gabriel Quiles // Shutterstock
#36. Russell County
– January unemployment rate (preliminary): 6.2%
— 1-month change: Up 1.2 percentage points
— 1-year change: Up 0.8 percentage points
– Total labor force: 6,462 people (403 unemployed)

Canva
#35. Lyon County
– January unemployment rate (preliminary): 6.3%
— 1-month change: Up 2.3 percentage points
— 1-year change: Up 1.3 percentage points
– Total labor force: 3,075 people (193 unemployed)
Canva
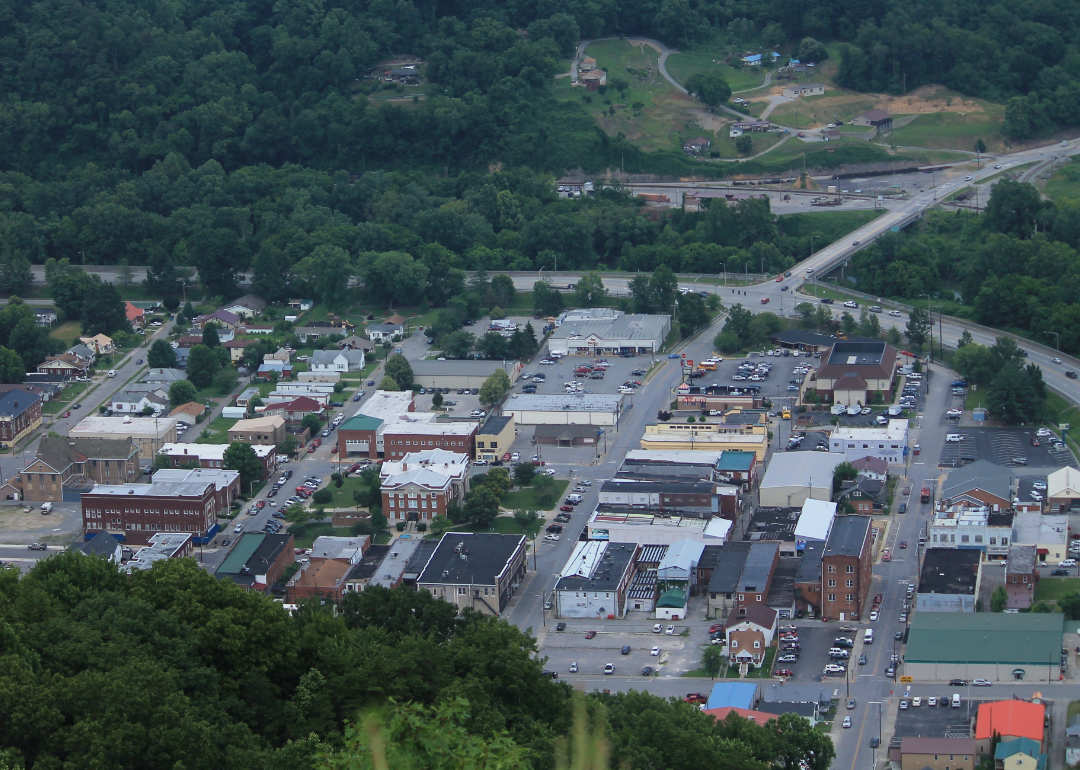
#34. Bell County
– January unemployment rate (preliminary): 6.3%
— 1-month change: Up 1.0 percentage points
— 1-year change: Up 0.9 percentage points
– Total labor force: 8,362 people (529 unemployed)
Canva
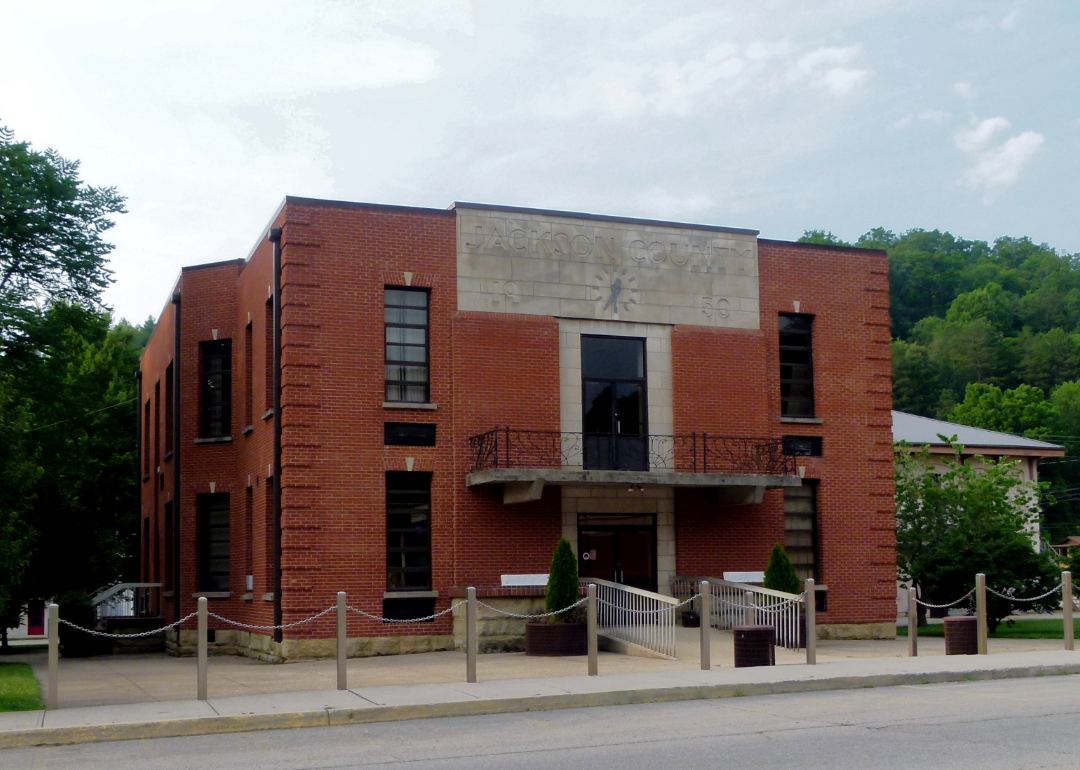
#33. Jackson County
– January unemployment rate (preliminary): 6.4%
— 1-month change: Up 1.0 percentage points
— 1-year change: Up 0.8 percentage points
– Total labor force: 4,336 people (276 unemployed)
Cody Thane Prater // Shutterstock
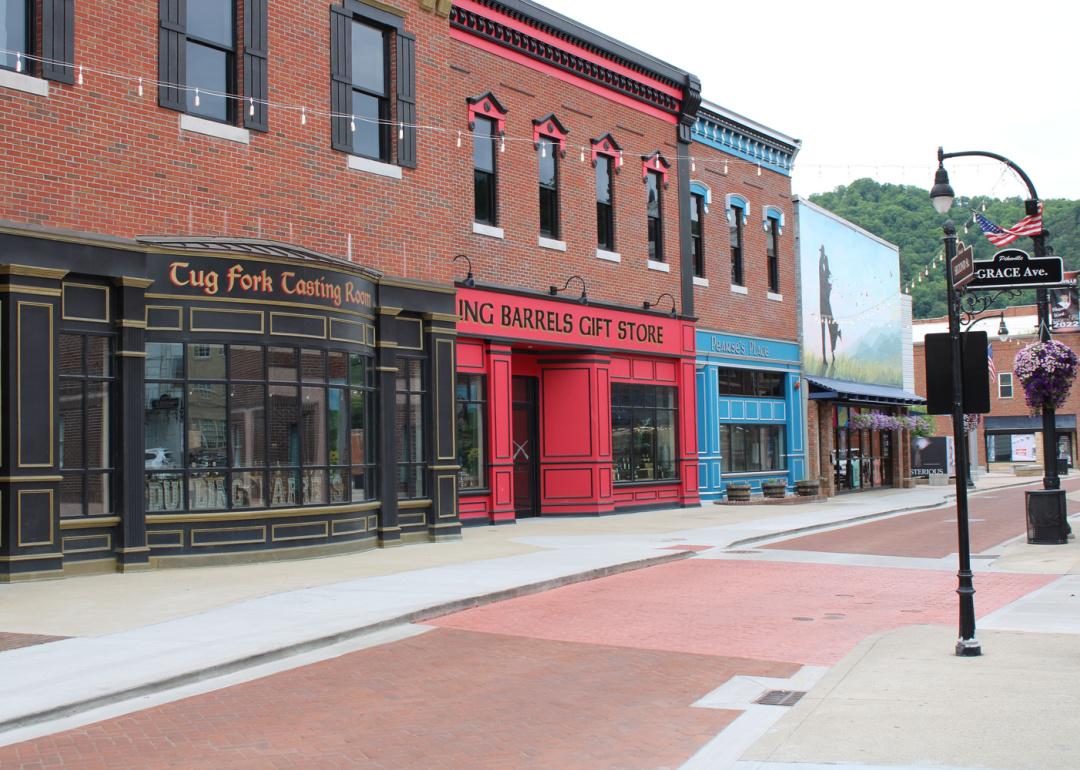
#32. Pike County
– January unemployment rate (preliminary): 6.4%
— 1-month change: Up 1.1 percentage points
— 1-year change: Up 1.4 percentage points
– Total labor force: 18,897 people (1,212 unemployed)
Canva
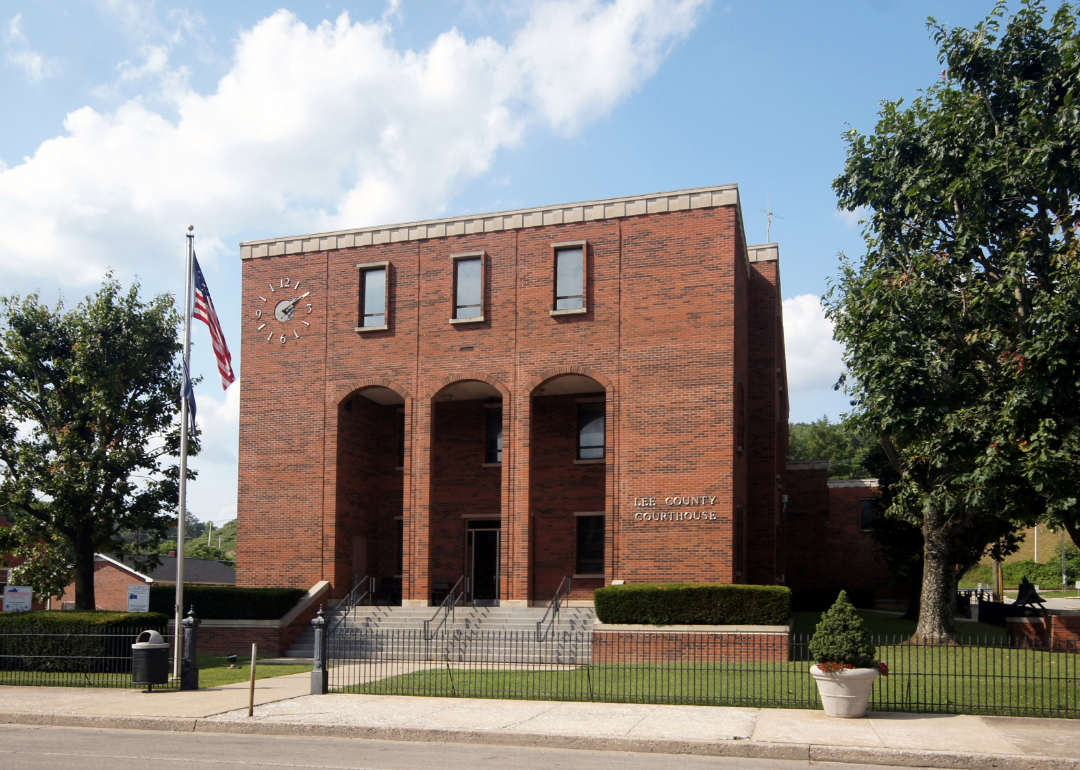
#31. Lee County
– January unemployment rate (preliminary): 6.5%
— 1-month change: Up 1.0 percentage points
— 1-year change: Up 1.3 percentage points
– Total labor force: 2,191 people (142 unemployed)

Patrick Jennings // Shutterstock
#30. Bracken County
– January unemployment rate (preliminary): 6.6%
— 1-month change: Up 2.5 percentage points
— 1-year change: Up 0.8 percentage points
– Total labor force: 3,771 people (249 unemployed)
Canva
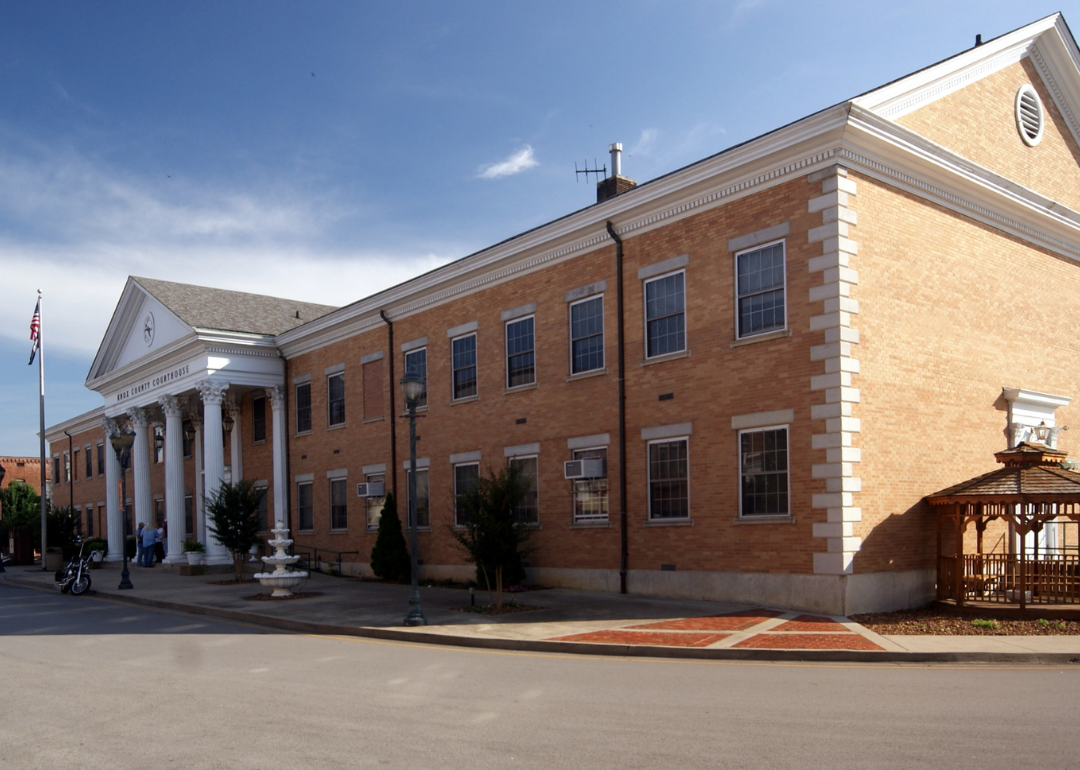
#29. Knox County
– January unemployment rate (preliminary): 6.6%
— 1-month change: Up 1.2 percentage points
— 1-year change: Up 1.3 percentage points
– Total labor force: 9,735 people (642 unemployed)
Rosemarie Mosteller // Shutterstock
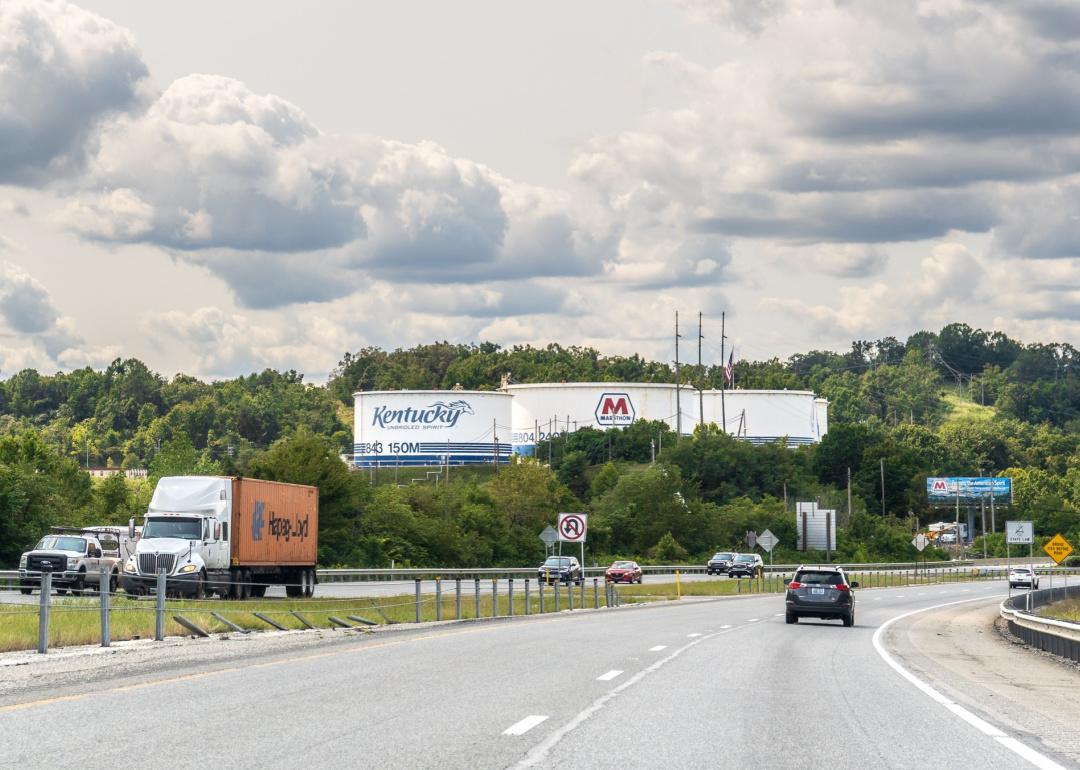
#28. Boyd County
– January unemployment rate (preliminary): 6.6%
— 1-month change: Up 1.5 percentage points
— 1-year change: Up 0.9 percentage points
– Total labor force: 17,122 people (1,122 unemployed)
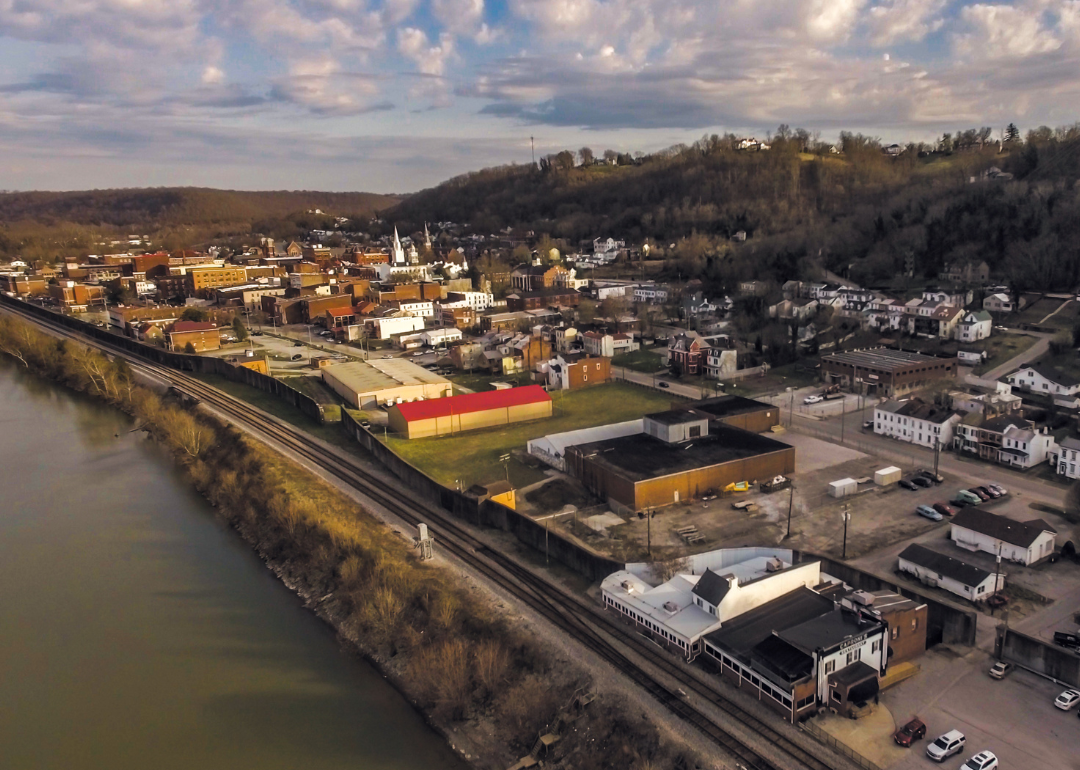
Canva
#27. Mason County
– January unemployment rate (preliminary): 6.7%
— 1-month change: Up 1.6 percentage points
— 1-year change: Up 1.3 percentage points
– Total labor force: 6,502 people (434 unemployed)
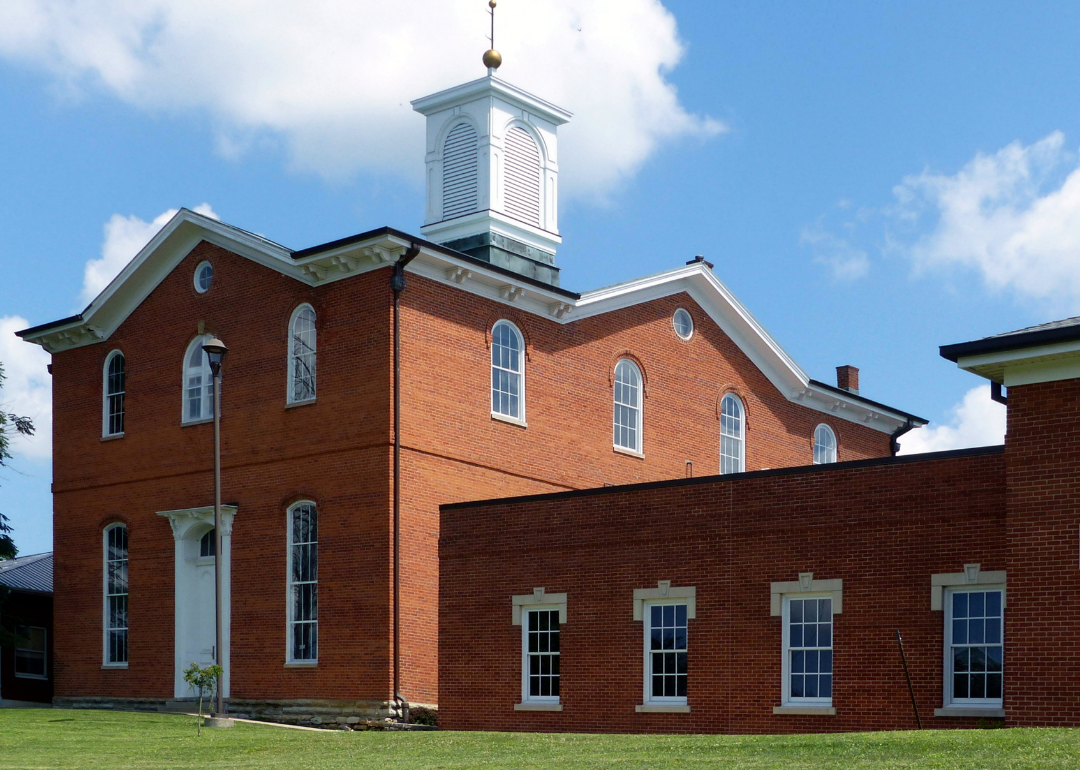
Canva
#26. Robertson County
– January unemployment rate (preliminary): 6.8%
— 1-month change: Up 2.0 percentage points
— 1-year change: Up 1.7 percentage points
– Total labor force: 799 people (54 unemployed)

Canva
#25. McCreary County
– January unemployment rate (preliminary): 6.8%
— 1-month change: Up 1.4 percentage points
— 1-year change: Up 0.9 percentage points
– Total labor force: 4,721 people (319 unemployed)

Canva
#24. Letcher County
– January unemployment rate (preliminary): 6.8%
— 1-month change: Up 0.9 percentage points
— 1-year change: Up 0.4 percentage points
– Total labor force: 5,919 people (403 unemployed)

Canva
#23. Perry County
– January unemployment rate (preliminary): 7.0%
— 1-month change: Up 1.6 percentage points
— 1-year change: Up 2.0 percentage points
– Total labor force: 7,903 people (550 unemployed)

Canva
#22. Ohio County
– January unemployment rate (preliminary): 7.0%
— 1-month change: Up 1.3 percentage points
— 1-year change: Up 1.5 percentage points
– Total labor force: 9,089 people (638 unemployed)

Canva
#21. Muhlenberg County
– January unemployment rate (preliminary): 7.0%
— 1-month change: Up 1.3 percentage points
— 1-year change: Up 0.8 percentage points
– Total labor force: 9,861 people (687 unemployed)

Canva
#20. Livingston County
– January unemployment rate (preliminary): 7.1%
— 1-month change: Up 2.4 percentage points
— 1-year change: Up 1.5 percentage points
– Total labor force: 3,656 people (261 unemployed)

Canva
#19. Clay County
– January unemployment rate (preliminary): 7.1%
— 1-month change: Up 1.0 percentage points
— 1-year change: Up 1.1 percentage points
– Total labor force: 5,083 people (360 unemployed)

anthony heflin // Shutterstock
#18. Harlan County
– January unemployment rate (preliminary): 7.1%
— 1-month change: Up 1.2 percentage points
— 1-year change: Up 1.0 percentage points
– Total labor force: 6,289 people (449 unemployed)

Nate Hovee // Shutterstock
#17. Floyd County
– January unemployment rate (preliminary): 7.2%
— 1-month change: Up 1.7 percentage points
— 1-year change: Up 1.1 percentage points
– Total labor force: 10,842 people (778 unemployed)

Canva
#16. Leslie County
– January unemployment rate (preliminary): 7.3%
— 1-month change: Up 0.9 percentage points
— 1-year change: Up 0.7 percentage points
– Total labor force: 2,463 people (179 unemployed)

Canva
#15. Morgan County
– January unemployment rate (preliminary): 7.3%
— 1-month change: Up 1.7 percentage points
— 1-year change: Up 0.3 percentage points
– Total labor force: 4,450 people (323 unemployed)

Marked Imagery // Shutterstock
#14. Greenup County
– January unemployment rate (preliminary): 7.7%
— 1-month change: Up 1.4 percentage points
— 1-year change: Up 0.5 percentage points
– Total labor force: 12,968 people (1,000 unemployed)
Canva
#13. Owsley County
– January unemployment rate (preliminary): 7.8%
— 1-month change: Up 1.2 percentage points
— 1-year change: Up 1.4 percentage points
– Total labor force: 1,133 people (88 unemployed)
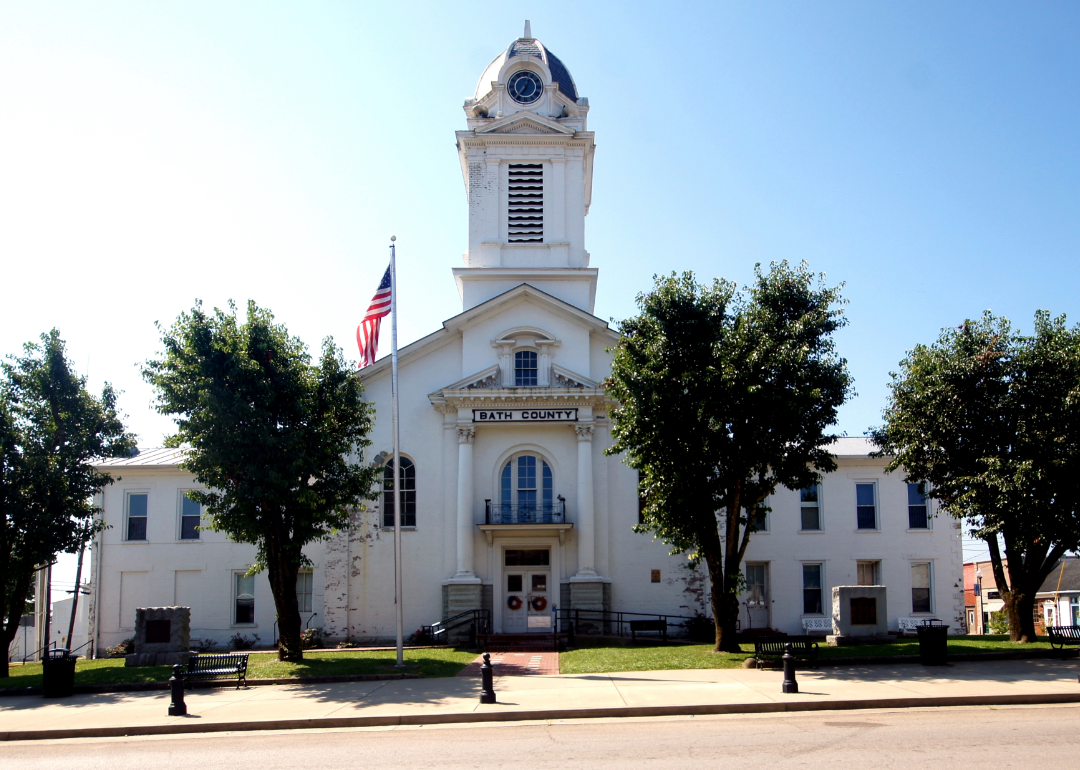
Canva
#12. Bath County
– January unemployment rate (preliminary): 7.8%
— 1-month change: Up 2.7 percentage points
— 1-year change: Up 1.2 percentage points
– Total labor force: 4,678 people (364 unemployed)

Canva
#11. Lawrence County
– January unemployment rate (preliminary): 7.8%
— 1-month change: Up 2.1 percentage points
— 1-year change: Up 1.8 percentage points
– Total labor force: 5,718 people (445 unemployed)

Canva
#10. Wolfe County
– January unemployment rate (preliminary): 8.0%
— 1-month change: Up 2.3 percentage points
— 1-year change: Up 0.8 percentage points
– Total labor force: 2,116 people (169 unemployed)
Canva
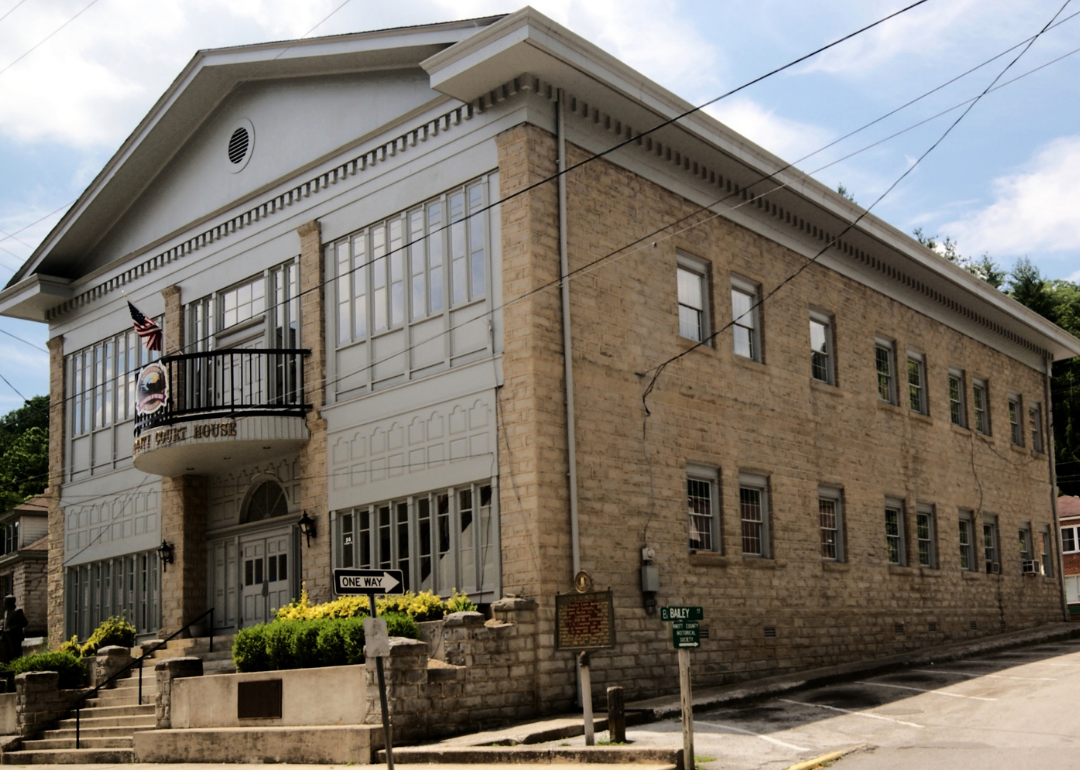
#9. Knott County
– January unemployment rate (preliminary): 8.0%
— 1-month change: Up 1.8 percentage points
— 1-year change: Up 1.3 percentage points
– Total labor force: 4,228 people (338 unemployed)
Johnnie Laws // Shutterstock
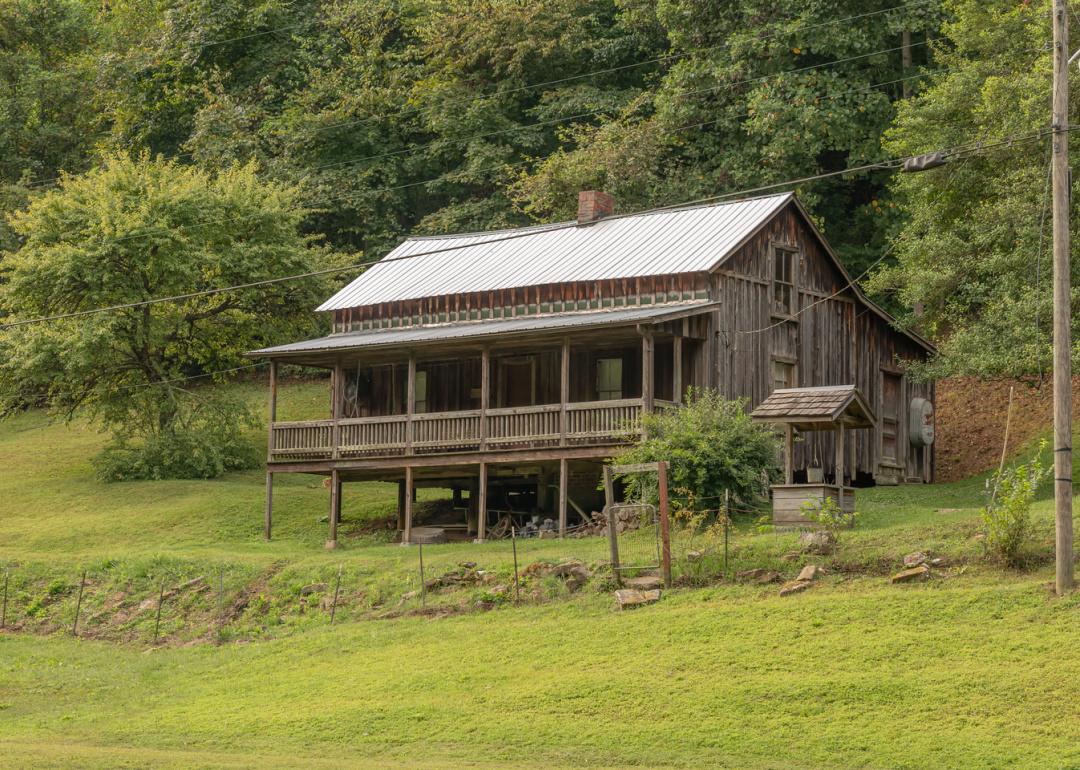
#8. Johnson County
– January unemployment rate (preliminary): 8.4%
— 1-month change: Up 2.1 percentage points
— 1-year change: Up 2.0 percentage points
– Total labor force: 6,689 people (560 unemployed)

Canva
#7. Menifee County
– January unemployment rate (preliminary): 9.4%
— 1-month change: Up 3.5 percentage points
— 1-year change: Up 2.2 percentage points
– Total labor force: 2,347 people (220 unemployed)

Canva
#6. Carter County
– January unemployment rate (preliminary): 9.9%
— 1-month change: Up 2.7 percentage points
— 1-year change: Up 1.0 percentage points
– Total labor force: 9,698 people (957 unemployed)

Canva
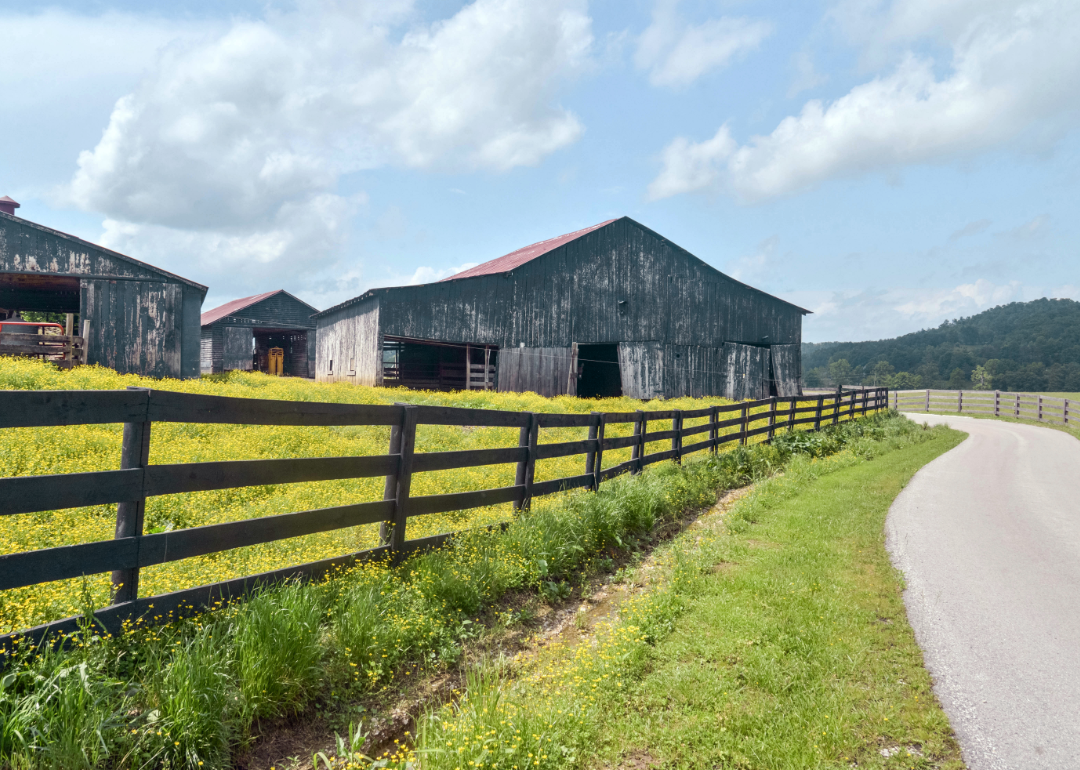
#5. Lewis County
– January unemployment rate (preliminary): 10.0%
— 1-month change: Up 2.0 percentage points
— 1-year change: Up 0.7 percentage points
– Total labor force: 4,543 people (455 unemployed)
Canva
#4. Martin County
– January unemployment rate (preliminary): 10.1%
— 1-month change: Up 1.9 percentage points
— 1-year change: Up 2.3 percentage points
– Total labor force: 2,188 people (222 unemployed)

Canva
#3. Breathitt County
– January unemployment rate (preliminary): 10.1%
— 1-month change: Up 3.0 percentage points
— 1-year change: Up 1.9 percentage points
– Total labor force: 3,210 people (323 unemployed)

Canva
#2. Elliott County
– January unemployment rate (preliminary): 11.3%
— 1-month change: Up 3.1 percentage points
— 1-year change: Up 1.2 percentage points
– Total labor force: 1,954 people (220 unemployed)

Cindy1988 // Shutterstock
#1. Magoffin County
– January unemployment rate (preliminary): 11.6%
— 1-month change: Up 2.6 percentage points
— 1-year change: No change
– Total labor force: 3,195 people (372 unemployed)
This story features data reporting by Paxtyn Merten and is part of a series utilizing data automation across 50 states.


