Cities with the fastest growing home prices in Bowling Green metro area
Published 9:07 pm Thursday, September 29, 2022
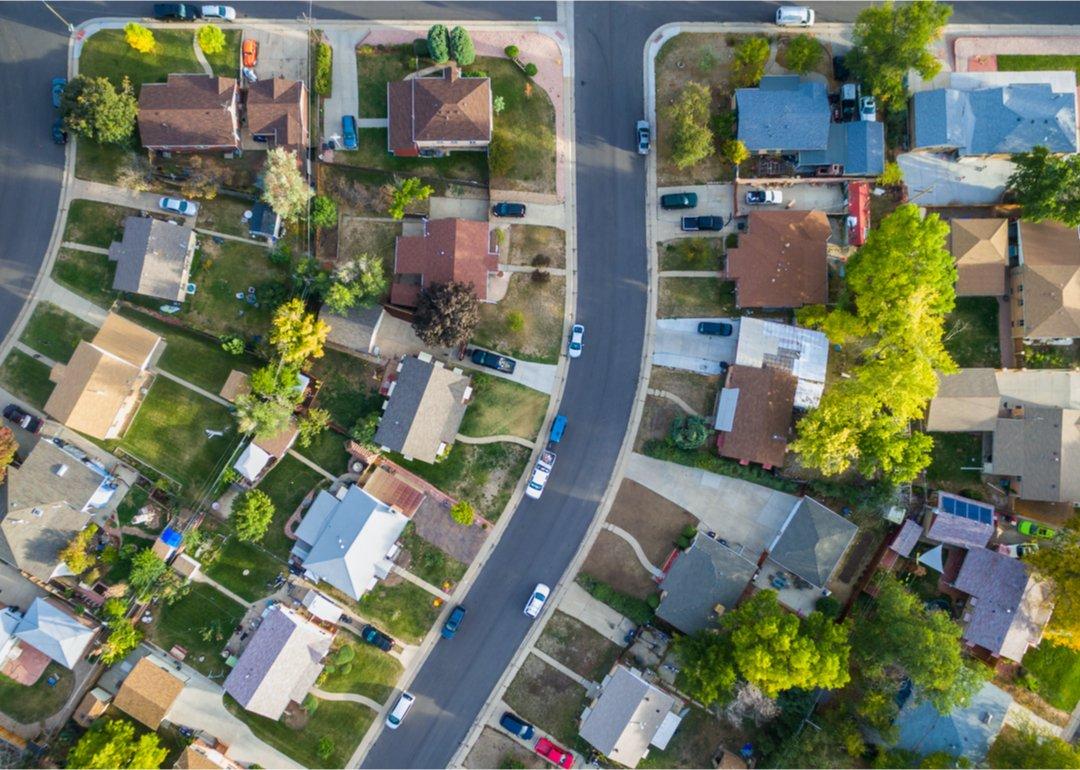
Arina P Habich // Shutterstock
Cities with the fastest growing home prices in Bowling Green metro area
It goes without saying that the coronavirus pandemic has sparked a wave of uncertainty across myriad industries, and not other market has quite felt its impact like that of real estate.
The pandemic has become a driving force behind the continued real estate boom, with high demand for vacation homes and a limited supply of housing that has prompted buyers and investors to bid up prices for affordable properties, causing home prices to skyrocket. The ability to work remotely played a role in the vacation home demand in mid-2020, as affluent Americans opted to ride out the pandemic with more amenities and space outside dense urban areas.
Stacker compiled a list of cities with the fastest-growing home prices in Bowling Green, KY metro area using data from Zillow. Cities are ranked by 1-year price change as of August 2022. The typical home value in the United States increased over the last year by +14.1% to $356,054. All 18 cities and towns with data available were included in the list.
You may also like: Cities with the fastest growing home prices in Bowling Green metro area
![]()

Stacker
#18. Rochester, Kentucky
– 1-year price change: +$8,696 (+8.8%)
– 5-year price change: +$33,975 (+45.9%)
– Typical home value: $108,009 (#16 most expensive city in metro)

Stacker
#17. Morgantown, Kentucky
– 1-year price change: +$8,802 (+8.9%)
– 5-year price change: +$36,412 (+51.3%)
– Typical home value: $107,333 (#17 most expensive city in metro)

Stacker
#16. Adolphus, Kentucky
– 1-year price change: +$11,270 (+13.0%)
– 5-year price change: +$31,686 (+47.7%)
– Typical home value: $98,073 (#18 most expensive city in metro)

Stacker
#15. Roundhill, Kentucky
– 1-year price change: +$14,785 (+13.0%)
– 5-year price change: +$47,442 (+58.2%)
– Typical home value: $128,893 (#14 most expensive city in metro)

Stacker
#14. Lewisburg, Kentucky
– 1-year price change: +$15,257 (+12.6%)
– 5-year price change: +$46,008 (+50.9%)
– Typical home value: $136,358 (#9 most expensive city in metro)
You may also like: Highest-earning zip codes in Bowling Green metro area

Stacker
#13. Bee Spring, Kentucky
– 1-year price change: +$15,301 (+13.6%)
– 5-year price change: +$33,971 (+36.1%)
– Typical home value: $128,054 (#15 most expensive city in metro)

Stacker
#12. Park City, Kentucky
– 1-year price change: +$15,583 (+13.0%)
– 5-year price change: +$44,292 (+48.5%)
– Typical home value: $135,570 (#10 most expensive city in metro)

Stacker
#11. Brownsville, Kentucky
– 1-year price change: +$16,752 (+14.7%)
– 5-year price change: +$37,440 (+40.1%)
– Typical home value: $130,878 (#13 most expensive city in metro)

Stacker
#10. Mammoth Cave, Kentucky
– 1-year price change: +$17,060 (+14.7%)
– 5-year price change: +$32,921 (+32.9%)
– Typical home value: $132,944 (#12 most expensive city in metro)

Stacker
#9. Scottsville, Kentucky
– 1-year price change: +$17,115 (+14.5%)
– 5-year price change: +$42,703 (+46.4%)
– Typical home value: $134,803 (#11 most expensive city in metro)
You may also like: How gas prices have changed in Bowling Green in the last week

Stacker
#8. Cub Run, Kentucky
– 1-year price change: +$23,196 (+16.7%)
– 5-year price change: +$59,663 (+58.1%)
– Typical home value: $162,376 (#7 most expensive city in metro)

Stacker
#7. Plum Springs, Kentucky
– 1-year price change: +$27,029 (+20.7%)
– 5-year price change: +$60,144 (+61.6%)
– Typical home value: $157,713 (#8 most expensive city in metro)

Stacker
#6. Smiths Grove, Kentucky
– 1-year price change: +$27,260 (+16.7%)
– 5-year price change: +$59,751 (+45.8%)
– Typical home value: $190,262 (#6 most expensive city in metro)

Stacker
#5. Woodburn, Kentucky
– 1-year price change: +$31,032 (+16.6%)
– 5-year price change: +$61,738 (+39.5%)
– Typical home value: $217,877 (#5 most expensive city in metro)

Stacker
#4. Bowling Green, Kentucky
– 1-year price change: +$37,503 (+18.5%)
– 5-year price change: +$69,618 (+40.9%)
– Typical home value: $239,934 (#2 most expensive city in metro)
You may also like: Most expensive homes for sale in Bowling Green

Stacker
#3. Rockfield, Kentucky
– 1-year price change: +$37,692 (+19.1%)
– 5-year price change: +$66,201 (+39.3%)
– Typical home value: $234,809 (#4 most expensive city in metro)

Stacker
#2. Oakland, Kentucky
– 1-year price change: +$38,444 (+19.6%)
– 5-year price change: +$68,572 (+41.2%)
– Typical home value: $235,006 (#3 most expensive city in metro)

Stacker
#1. Alvaton, Kentucky
– 1-year price change: +$50,428 (+18.0%)
– 5-year price change: +$93,071 (+39.1%)
– Typical home value: $331,110 (#1 most expensive city in metro)


