Counties with the highest unemployment rate in Kentucky
Published 10:02 am Monday, August 8, 2022
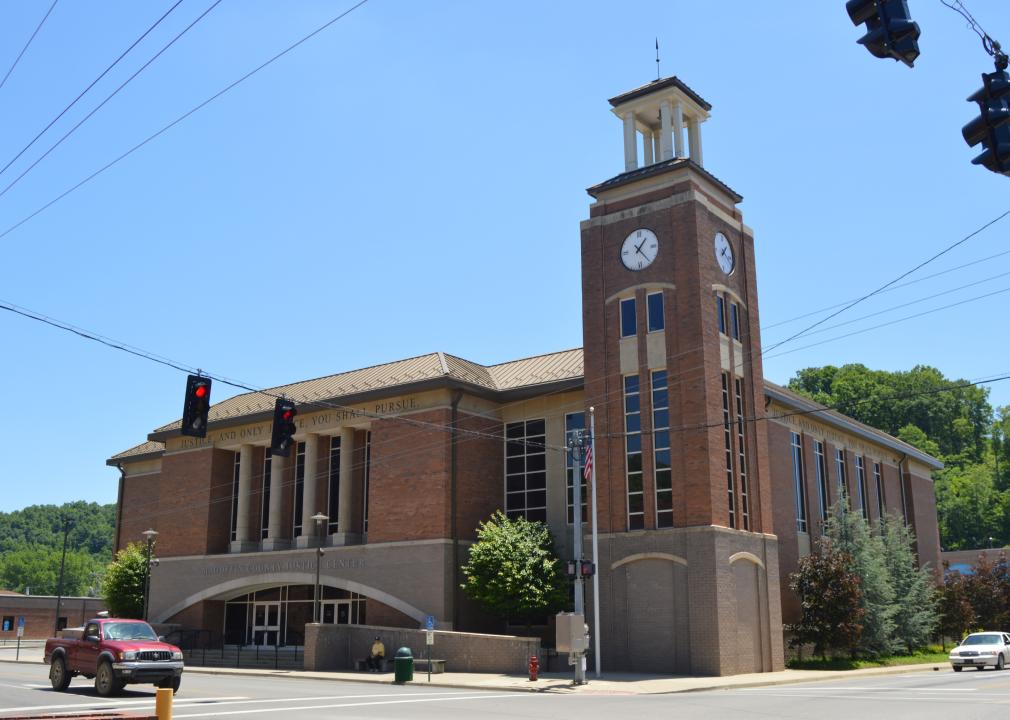
Nyttend // Wikimedia Commons
Counties with the highest unemployment rate in Kentucky
Unemployment rates, while significantly lower than the alarming pandemic peak of 14.7% experienced in April 2020, remain a subject of concern, notably as economic experts bandy around the idea of a potential recession by 2023. The last economic recession—the Great Recession of 2008-2010—sent rates up to 10% as of October 2009. It was not until the spring of 2019 that unemployment finally went down to the same level it sits at now.
As of June of this year, national unemployment is at 3.5%, 0.1% lower than in May, marking a three-month stagnation—following a steady drop since that aforementioned COVID-affected peak. Seasonally adjusted unemployment rates by state demonstrate a rather sizable spectrum, ranging from just 1.8% in Minnesota, to 4.9% in New Mexico and 5.5% in the District of Columbia. Further breakdown by the U.S. Bureau of Labor Statistics shows yet another county-based spectrum within each state.
To that end, Stacker compiled a list of counties with the highest unemployment rate in Kentucky using data from the BLS. Counties are ranked by unemployment rate in June 2022, which as of this writing is the most current Bureau data.
You may also like: Counties with the oldest homes in Kentucky
![]()

Brian Stansberry // Wikimedia Commons
#50. Hickman County
– Current Unemployment rate: 4.9%
— 1 month change: +1.0%
— 1 year change: -0.9%
-Total Labor Force: 1,690 (83 unemployed)

W.marsh // Wikimedia Commons
#49. Montgomery County
– Current Unemployment rate: 5.0%
— 1 month change: +0.8%
— 1 year change: -1.1%
-Total Labor Force: 11,943 (592 unemployed)

W.marsh // Wikimedia Commons
#48. Robertson County
– Current Unemployment rate: 5.0%
— 1 month change: +0.7%
— 1 year change: 0.0%
-Total Labor Force: 806 (40 unemployed)

Jim.henderson // Wikimedia Commons
#47. Hopkins County
– Current Unemployment rate: 5.0%
— 1 month change: +0.6%
— 1 year change: -1.0%
-Total Labor Force: 18,204 (907 unemployed)

FloNight (Sydney Poore) and Russell Poore // Wikimedia Commons
#46. Fleming County
– Current Unemployment rate: 5.0%
— 1 month change: +1.0%
— 1 year change: -0.8%
-Total Labor Force: 6,055 (303 unemployed)
You may also like: Most popular baby names for girls of the last decade in Kentucky

W.marsh // Wikimedia Commons
#45. Adair County
– Current Unemployment rate: 5.0%
— 1 month change: +1.1%
— 1 year change: -1.3%
-Total Labor Force: 7,136 (360 unemployed)

Calvin Beale // Wikimedia Commons
#44. Fulton County
– Current Unemployment rate: 5.0%
— 1 month change: +0.7%
— 1 year change: -2.0%
-Total Labor Force: 2,080 (105 unemployed)

Joel Bradshaw // Wikimedia Commons
#43. Ohio County
– Current Unemployment rate: 5.1%
— 1 month change: +0.4%
— 1 year change: -1.3%
-Total Labor Force: 9,118 (461 unemployed)

Huw Williams (Huwmanbeing) // Wikimedia Commons
#42. Grayson County
– Current Unemployment rate: 5.1%
— 1 month change: +0.5%
— 1 year change: -1.4%
-Total Labor Force: 10,652 (539 unemployed)

Nyttend // Wikimedia Commons
#41. Metcalfe County
– Current Unemployment rate: 5.1%
— 1 month change: +0.6%
— 1 year change: -1.4%
-Total Labor Force: 3,925 (201 unemployed)
You may also like: Best places to live in Kentucky

verygreen // Wikimedia Commons
#40. Rockcastle County
– Current Unemployment rate: 5.1%
— 1 month change: +1.0%
— 1 year change: -0.9%
-Total Labor Force: 6,647 (341 unemployed)

FloNight (Sydney Poore) and Russell Poore // Wikimedia Commons
#39. Lincoln County
– Current Unemployment rate: 5.2%
— 1 month change: +0.8%
— 1 year change: -1.2%
-Total Labor Force: 9,375 (486 unemployed)

Greg5030 // Wikimedia Commons
#38. Mason County
– Current Unemployment rate: 5.2%
— 1 month change: +1.0%
— 1 year change: -1.2%
-Total Labor Force: 6,652 (346 unemployed)

Huw Williams (Huwmanbeing) // Wikimedia Commons
#37. Edmonson County
– Current Unemployment rate: 5.2%
— 1 month change: +0.9%
— 1 year change: -1.4%
-Total Labor Force: 4,757 (249 unemployed)

Nyttend // Wikimedia Commons
#36. Livingston County
– Current Unemployment rate: 5.3%
— 1 month change: +0.6%
— 1 year change: -1.2%
-Total Labor Force: 3,621 (191 unemployed)
You may also like: Most popular boy names in the 80s in Kentucky

Jonathunder // Wikimedia Commons
#35. Ballard County
– Current Unemployment rate: 5.3%
— 1 month change: +0.2%
— 1 year change: -0.5%
-Total Labor Force: 3,448 (182 unemployed)

JERRYE & ROY KLOTZ MD // Wikimedia Commons
#34. Wayne County
– Current Unemployment rate: 5.3%
— 1 month change: +0.6%
— 1 year change: -0.6%
-Total Labor Force: 7,210 (384 unemployed)

Brian Stansberry // Wikimedia Commons
#33. Christian County
– Current Unemployment rate: 5.4%
— 1 month change: +0.5%
— 1 year change: -2.0%
-Total Labor Force: 25,323 (1,360 unemployed)

Nyttend // Wikimedia Commons
#32. Russell County
– Current Unemployment rate: 5.5%
— 1 month change: +1.0%
— 1 year change: -1.1%
-Total Labor Force: 6,237 (341 unemployed)

Nyttend // Wikimedia Commons
#31. Morgan County
– Current Unemployment rate: 5.5%
— 1 month change: +0.9%
— 1 year change: -1.2%
-Total Labor Force: 4,366 (239 unemployed)
You may also like: Breonna Taylor becomes a martyr for the movement: A major civil rights moment in Kentucky

W.marsh // Wikimedia Commons
#30. Bath County
– Current Unemployment rate: 5.5%
— 1 month change: +0.9%
— 1 year change: -0.7%
-Total Labor Force: 4,707 (258 unemployed)

Nyttend // Wikimedia Commons
#29. Estill County
– Current Unemployment rate: 5.6%
— 1 month change: +1.1%
— 1 year change: -0.6%
-Total Labor Force: 5,240 (292 unemployed)

Kybluegrass // Wikimedia Commons
#28. McCreary County
– Current Unemployment rate: 5.7%
— 1 month change: +1.1%
— 1 year change: -1.6%
-Total Labor Force: 4,831 (274 unemployed)

W.marsh // Wikimedia Commons
#27. Rowan County
– Current Unemployment rate: 5.7%
— 1 month change: +1.3%
— 1 year change: -0.7%
-Total Labor Force: 9,671 (549 unemployed)

Nyttend // Wikimedia Commons
#26. Bell County
– Current Unemployment rate: 5.7%
— 1 month change: +1.0%
— 1 year change: -1.5%
-Total Labor Force: 8,293 (475 unemployed)
You may also like: Most popular girl names in the 70s in Kentucky

w:User:Malepheasant // Wikimedia Commons
#25. Boyd County
– Current Unemployment rate: 5.7%
— 1 month change: +0.9%
— 1 year change: -1.5%
-Total Labor Force: 17,532 (1,005 unemployed)

Nyttend // Wikimedia Commons
#24. Perry County
– Current Unemployment rate: 5.9%
— 1 month change: +0.9%
— 1 year change: -1.5%
-Total Labor Force: 8,105 (477 unemployed)

Nyttend // Wikimedia Commons
#23. Knox County
– Current Unemployment rate: 6.0%
— 1 month change: +0.9%
— 1 year change: -1.5%
-Total Labor Force: 10,313 (614 unemployed)

Nyttend // Wikimedia Commons
#22. Pike County
– Current Unemployment rate: 6.0%
— 1 month change: +0.8%
— 1 year change: -1.3%
-Total Labor Force: 19,035 (1,143 unemployed)

Nyttend // Wikimedia Commons
#21. Lawrence County
– Current Unemployment rate: 6.0%
— 1 month change: +1.1%
— 1 year change: -1.5%
-Total Labor Force: 5,524 (332 unemployed)
You may also like: What Kentucky’s immigrant population looked like in 1900

Nyttend // Wikimedia Commons
#20. Menifee County
– Current Unemployment rate: 6.2%
— 1 month change: +0.9%
— 1 year change: -1.2%
-Total Labor Force: 2,386 (147 unemployed)

Nyttend // Wikimedia Commons
#19. Wolfe County
– Current Unemployment rate: 6.2%
— 1 month change: +1.3%
— 1 year change: -0.6%
-Total Labor Force: 2,297 (142 unemployed)

Turover // Wikimedia Commons
#18. Greenup County
– Current Unemployment rate: 6.5%
— 1 month change: +1.0%
— 1 year change: -1.3%
-Total Labor Force: 13,201 (852 unemployed)

W.marsh // Wikimedia Commons
#17. Lee County
– Current Unemployment rate: 6.5%
— 1 month change: +1.4%
— 1 year change: -0.6%
-Total Labor Force: 2,047 (134 unemployed)

Megangen1990 // Wikimedia Commons
#16. Muhlenberg County
– Current Unemployment rate: 6.6%
— 1 month change: +0.9%
— 1 year change: -1.2%
-Total Labor Force: 9,745 (639 unemployed)
You may also like: Counties with highest COVID-19 infection rates in Kentucky

W.marsh // Wikimedia Commons
#15. Jackson County
– Current Unemployment rate: 6.6%
— 1 month change: +1.0%
— 1 year change: -0.8%
-Total Labor Force: 4,203 (277 unemployed)

Nyttend // Wikimedia Commons
#14. Clay County
– Current Unemployment rate: 6.7%
— 1 month change: +1.3%
— 1 year change: -1.4%
-Total Labor Force: 5,241 (349 unemployed)

Nyttend // Wikimedia Commons
#13. Floyd County
– Current Unemployment rate: 6.7%
— 1 month change: +0.9%
— 1 year change: -1.4%
-Total Labor Force: 11,076 (738 unemployed)

HiB2Bornot2B // Wikimedia Commons
#12. Johnson County
– Current Unemployment rate: 6.9%
— 1 month change: +0.9%
— 1 year change: -1.6%
-Total Labor Force: 6,769 (466 unemployed)

Nyttend // Wikimedia Commons
#11. Letcher County
– Current Unemployment rate: 7.0%
— 1 month change: +1.0%
— 1 year change: -2.1%
-Total Labor Force: 6,210 (437 unemployed)
You may also like: States where people in Kentucky are getting new jobs

Nyttend // Wikimedia Commons
#10. Knott County
– Current Unemployment rate: 7.2%
— 1 month change: +1.2%
— 1 year change: -1.3%
-Total Labor Force: 4,342 (311 unemployed)

C. Bedford Crenshaw // Wikimedia Commons
#9. Lewis County
– Current Unemployment rate: 7.6%
— 1 month change: +1.1%
— 1 year change: -1.0%
-Total Labor Force: 4,745 (359 unemployed)

W.marsh // Wikimedia Commons
#8. Harlan County
– Current Unemployment rate: 7.7%
— 1 month change: +1.2%
— 1 year change: -2.7%
-Total Labor Force: 6,648 (510 unemployed)

JERRYE & ROY KLOTZ MD // Wikimedia Commons
#7. Owsley County
– Current Unemployment rate: 7.9%
— 1 month change: +1.1%
— 1 year change: -0.6%
-Total Labor Force: 1,053 (83 unemployed)

Nyttend // Wikimedia Commons
#6. Leslie County
– Current Unemployment rate: 8.1%
— 1 month change: +1.3%
— 1 year change: -1.2%
-Total Labor Force: 2,568 (207 unemployed)
You may also like: Most rural counties in Kentucky

CoryClaxon // Wikimedia Commons
#5. Carter County
– Current Unemployment rate: 8.2%
— 1 month change: +1.6%
— 1 year change: -0.4%
-Total Labor Force: 9,968 (815 unemployed)

Nyttend // Wikimedia Commons
#4. Martin County
– Current Unemployment rate: 8.8%
— 1 month change: +1.2%
— 1 year change: -2.0%
-Total Labor Force: 2,318 (204 unemployed)

Nyttend // Wikimedia Commons
#3. Breathitt County
– Current Unemployment rate: 9.1%
— 1 month change: +1.2%
— 1 year change: -0.5%
-Total Labor Force: 3,312 (303 unemployed)

Nyttend // Wikimedia Commons
#2. Elliott County
– Current Unemployment rate: 9.3%
— 1 month change: +1.9%
— 1 year change: -0.4%
-Total Labor Force: 1,863 (174 unemployed)

Nyttend // Wikimedia Commons
#1. Magoffin County
– Current Unemployment rate: 12.1%
— 1 month change: +1.0%
— 1 year change: -1.2%
-Total Labor Force: 3,364 (408 unemployed)
You may also like: Highest-rated things to do in Kentucky, according to Tripadvisor


