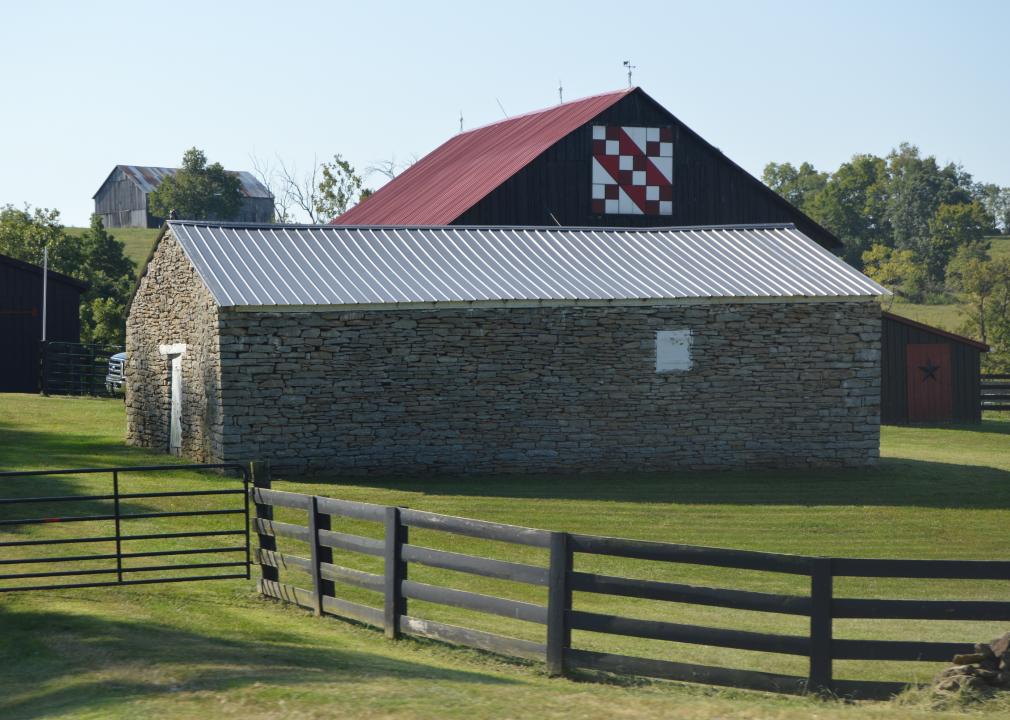
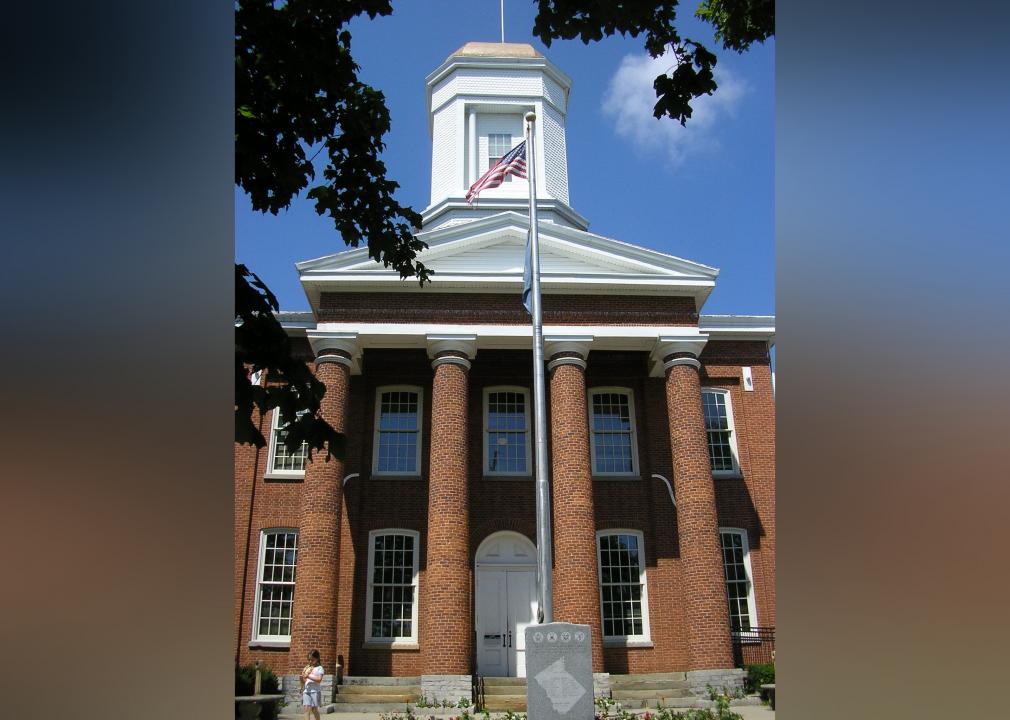
Counties with the worst commutes in Kentucky
Published 6:40 am Wednesday, July 27, 2022
C. Bedford Crenshaw // Wikimedia Commons
Counties with the worst commutes in Kentucky
Commuting easily ranks as one of the least enjoyable parts of a person’s day. Commuters encounter more physical health problems, and low-income commuters are less likely to gain financial stability—among a host of other negative impacts. And yet, America’s commutes keep getting longer as people move farther away from the office, according to census data.
Stacker compiled a list of counties with the worst commutes in Kentucky using data from the U.S. Census Bureau. Counties are ranked by longest average commute time according to 2020 5-year estimates.
![]()
W.marsh // Wikimedia Commons
#50. Shelby County
– Average Commute Time: 27 minutes
— 3.3 minutes longer than state average
– Workers with 60+ minute commute: 5.7%
– Left for work from 12 a.m. to 6 a.m. 14.3%
– Worked outside county of residence: 49.3%
– Means of transportation: drove alone (79.4%), carpooled (9.6%), walked to work (1.1%), public transportation (1.1%), worked from home (6.8%)
W.marsh // Wikimedia Commons
#49. Larue County
– Average Commute Time: 27.1 minutes
— 3.4 minutes longer than state average
– Workers with 60+ minute commute: 5.9%
– Left for work from 12 a.m. to 6 a.m. 15.2%
– Worked outside county of residence: 71.2%
– Means of transportation: drove alone (86.2%), carpooled (9.6%), walked to work (0.3%), public transportation (0.0%), worked from home (3.8%)
Nyttend // Wikimedia Commons
#48. Anderson County
– Average Commute Time: 27.3 minutes
— 3.6 minutes longer than state average
– Workers with 60+ minute commute: 6.3%
– Left for work from 12 a.m. to 6 a.m. 9.9%
– Worked outside county of residence: 67.6%
– Means of transportation: drove alone (83.6%), carpooled (9.1%), walked to work (0.8%), public transportation (0.1%), worked from home (5.4%)
Bedford // Wikimedia Commons
#47. Webster County
– Average Commute Time: 27.3 minutes
— 3.6 minutes longer than state average
– Workers with 60+ minute commute: 8.5%
– Left for work from 12 a.m. to 6 a.m. 24.1%
– Worked outside county of residence: 54.0%
– Means of transportation: drove alone (85.8%), carpooled (10.9%), walked to work (1.6%), public transportation (0.0%), worked from home (1.7%)
Brian Stansberry // Wikimedia Commons
#46. Harrison County
– Average Commute Time: 27.6 minutes
— 3.9 minutes longer than state average
– Workers with 60+ minute commute: 10.9%
– Left for work from 12 a.m. to 6 a.m. 17.3%
– Worked outside county of residence: 44.8%
– Means of transportation: drove alone (79.6%), carpooled (11.9%), walked to work (2.5%), public transportation (0.0%), worked from home (4.4%)
Nyttend // Wikimedia Commons
#45. Wolfe County
– Average Commute Time: 27.6 minutes
— 3.9 minutes longer than state average
– Workers with 60+ minute commute: 15.0%
– Left for work from 12 a.m. to 6 a.m. 19.4%
– Worked outside county of residence: 44.7%
– Means of transportation: drove alone (79.6%), carpooled (17.9%), walked to work (0.1%), public transportation (0.0%), worked from home (0.8%)
Huw Williams (Huwmanbeing) // Wikimedia Commons
#44. Grayson County
– Average Commute Time: 27.7 minutes
— 4.0 minutes longer than state average
– Workers with 60+ minute commute: 13.7%
– Left for work from 12 a.m. to 6 a.m. 29.5%
– Worked outside county of residence: 31.7%
– Means of transportation: drove alone (81.3%), carpooled (11.6%), walked to work (2.0%), public transportation (0.1%), worked from home (2.4%)
Brian Stansberry // Wikimedia Commons
#43. Butler County
– Average Commute Time: 27.8 minutes
— 4.1 minutes longer than state average
– Workers with 60+ minute commute: 7.9%
– Left for work from 12 a.m. to 6 a.m. 24.1%
– Worked outside county of residence: 47.0%
– Means of transportation: drove alone (82.8%), carpooled (12.5%), walked to work (0.8%), public transportation (0.7%), worked from home (2.9%)
W.marsh // Wikimedia Commons
#42. Oldham County
– Average Commute Time: 28 minutes
— 4.3 minutes longer than state average
– Workers with 60+ minute commute: 5.8%
– Left for work from 12 a.m. to 6 a.m. 9.6%
– Worked outside county of residence: 61.4%
– Means of transportation: drove alone (82.5%), carpooled (6.0%), walked to work (0.6%), public transportation (0.2%), worked from home (9.9%)
Nyttend // Wikimedia Commons
#41. Gallatin County
– Average Commute Time: 28 minutes
— 4.3 minutes longer than state average
– Workers with 60+ minute commute: 6.3%
– Left for work from 12 a.m. to 6 a.m. 25.6%
– Worked outside county of residence: 55.2%
– Means of transportation: drove alone (78.5%), carpooled (15.9%), walked to work (1.5%), public transportation (0.0%), worked from home (4.0%)
Nyttend // Wikimedia Commons
#40. Mercer County
– Average Commute Time: 28 minutes
— 4.3 minutes longer than state average
– Workers with 60+ minute commute: 9.5%
– Left for work from 12 a.m. to 6 a.m. 17.0%
– Worked outside county of residence: 46.5%
– Means of transportation: drove alone (82.7%), carpooled (11.7%), walked to work (0.2%), public transportation (0.2%), worked from home (4.7%)
W.marsh // Wikimedia Commons
#39. Bullitt County
– Average Commute Time: 28.1 minutes
— 4.4 minutes longer than state average
– Workers with 60+ minute commute: 3.8%
– Left for work from 12 a.m. to 6 a.m. 19.9%
– Worked outside county of residence: 65.2%
– Means of transportation: drove alone (85.4%), carpooled (8.3%), walked to work (0.7%), public transportation (0.1%), worked from home (4.4%)
Nyttend // Wikimedia Commons
#38. Lawrence County
– Average Commute Time: 28.1 minutes
— 4.4 minutes longer than state average
– Workers with 60+ minute commute: 8.2%
– Left for work from 12 a.m. to 6 a.m. 16.9%
– Worked outside county of residence: 39.4%
– Means of transportation: drove alone (86.5%), carpooled (10.5%), walked to work (0.3%), public transportation (0.6%), worked from home (1.0%)
Brian Stansberry // Wikimedia Commons
#37. Monroe County
– Average Commute Time: 28.3 minutes
— 4.6 minutes longer than state average
– Workers with 60+ minute commute: 13.8%
– Left for work from 12 a.m. to 6 a.m. 21.9%
– Worked outside county of residence: 27.8%
– Means of transportation: drove alone (78.4%), carpooled (13.4%), walked to work (2.7%), public transportation (0.5%), worked from home (4.6%)
HiB2Bornot2B // Wikimedia Commons
#36. Johnson County
– Average Commute Time: 28.5 minutes
— 4.8 minutes longer than state average
– Workers with 60+ minute commute: 11.7%
– Left for work from 12 a.m. to 6 a.m. 11.6%
– Worked outside county of residence: 40.2%
– Means of transportation: drove alone (80.6%), carpooled (13.0%), walked to work (2.1%), public transportation (0.2%), worked from home (4.0%)
Nyttend // Wikimedia Commons
#35. Henry County
– Average Commute Time: 29 minutes
— 5.3 minutes longer than state average
– Workers with 60+ minute commute: 6.7%
– Left for work from 12 a.m. to 6 a.m. 18.9%
– Worked outside county of residence: 62.7%
– Means of transportation: drove alone (82.1%), carpooled (10.6%), walked to work (1.5%), public transportation (0.0%), worked from home (5.2%)
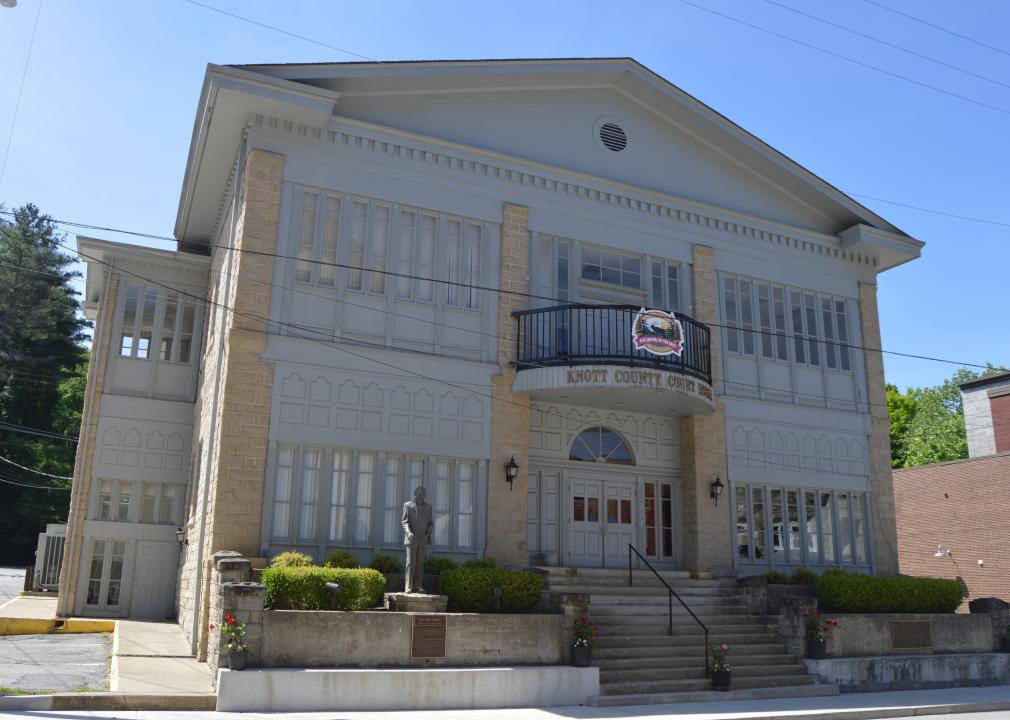
Nyttend // Wikimedia Commons
#34. Knott County
– Average Commute Time: 29 minutes
— 5.3 minutes longer than state average
– Workers with 60+ minute commute: 9.6%
– Left for work from 12 a.m. to 6 a.m. 14.0%
– Worked outside county of residence: 51.2%
– Means of transportation: drove alone (78.8%), carpooled (9.6%), walked to work (3.9%), public transportation (0.6%), worked from home (5.6%)
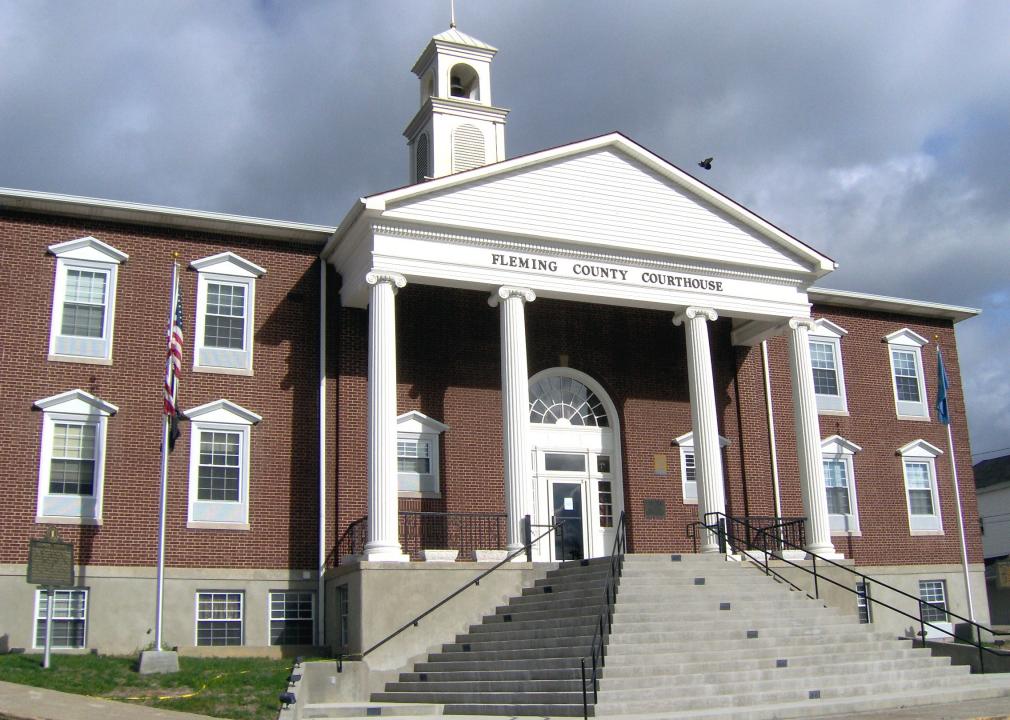
FloNight (Sydney Poore) and Russell Poore // Wikimedia Commons
#33. Fleming County
– Average Commute Time: 29.2 minutes
— 5.5 minutes longer than state average
– Workers with 60+ minute commute: 14.9%
– Left for work from 12 a.m. to 6 a.m. 20.5%
– Worked outside county of residence: 43.6%
– Means of transportation: drove alone (77.8%), carpooled (13.7%), walked to work (1.6%), public transportation (0.2%), worked from home (6.2%)
Nyttend // Wikimedia Commons
#32. Grant County
– Average Commute Time: 29.3 minutes
— 5.6 minutes longer than state average
– Workers with 60+ minute commute: 10.2%
– Left for work from 12 a.m. to 6 a.m. 24.3%
– Worked outside county of residence: 55.9%
– Means of transportation: drove alone (80.9%), carpooled (12.7%), walked to work (2.3%), public transportation (0.0%), worked from home (3.3%)
JERRYE & ROY KLOTZ MD // Wikimedia Commons
#31. Hart County
– Average Commute Time: 29.4 minutes
— 5.7 minutes longer than state average
– Workers with 60+ minute commute: 14.4%
– Left for work from 12 a.m. to 6 a.m. 25.9%
– Worked outside county of residence: 43.1%
– Means of transportation: drove alone (79.7%), carpooled (14.5%), walked to work (0.9%), public transportation (0.3%), worked from home (2.6%)
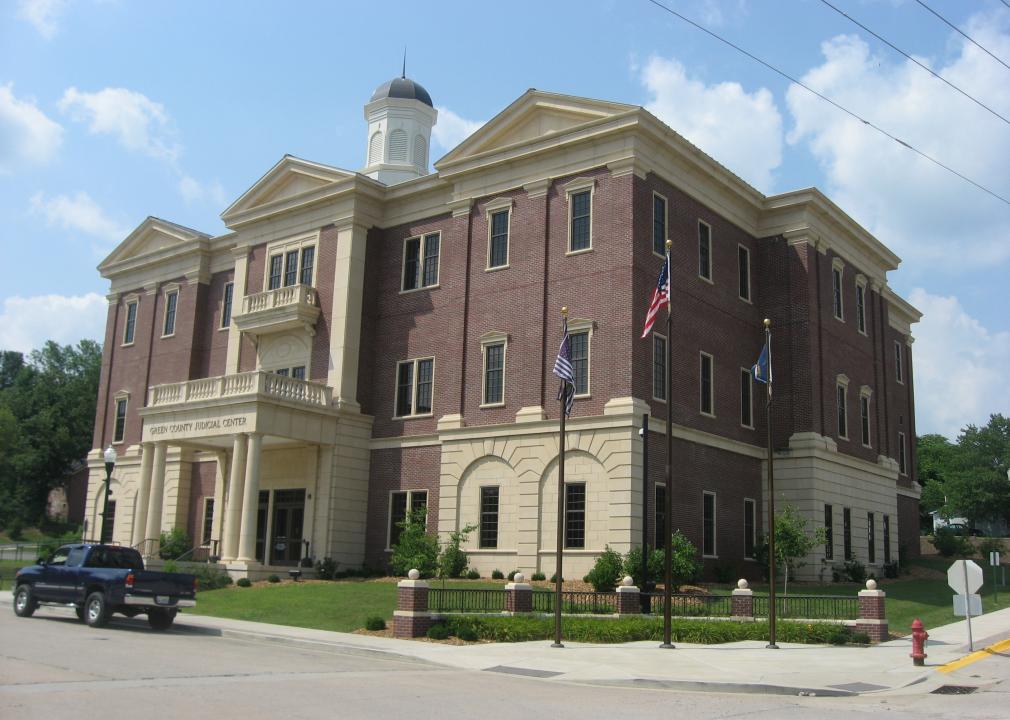
Nyttend // Wikimedia Commons
#30. Green County
– Average Commute Time: 29.7 minutes
— 6.0 minutes longer than state average
– Workers with 60+ minute commute: 11.1%
– Left for work from 12 a.m. to 6 a.m. 24.7%
– Worked outside county of residence: 58.9%
– Means of transportation: drove alone (78.4%), carpooled (12.9%), walked to work (1.4%), public transportation (1.6%), worked from home (5.7%)
Nyttend // Wikimedia Commons
#29. Morgan County
– Average Commute Time: 29.8 minutes
— 6.1 minutes longer than state average
– Workers with 60+ minute commute: 15.0%
– Left for work from 12 a.m. to 6 a.m. 13.8%
– Worked outside county of residence: 32.1%
– Means of transportation: drove alone (86.4%), carpooled (10.1%), walked to work (0.3%), public transportation (0.3%), worked from home (2.3%)
FloNight (Sydney Poore) and Russell Poore // Wikimedia Commons
#28. Lincoln County
– Average Commute Time: 30.1 minutes
— 6.4 minutes longer than state average
– Workers with 60+ minute commute: 12.4%
– Left for work from 12 a.m. to 6 a.m. 14.6%
– Worked outside county of residence: 55.3%
– Means of transportation: drove alone (79.8%), carpooled (10.2%), walked to work (2.0%), public transportation (0.5%), worked from home (7.0%)
Nyttend // Wikimedia Commons
#27. Casey County
– Average Commute Time: 30.2 minutes
— 6.5 minutes longer than state average
– Workers with 60+ minute commute: 11.0%
– Left for work from 12 a.m. to 6 a.m. 22.3%
– Worked outside county of residence: 41.2%
– Means of transportation: drove alone (77.8%), carpooled (15.0%), walked to work (1.5%), public transportation (0.5%), worked from home (4.2%)
W.marsh // Wikimedia Commons
#26. Bath County
– Average Commute Time: 30.6 minutes
— 6.9 minutes longer than state average
– Workers with 60+ minute commute: 13.8%
– Left for work from 12 a.m. to 6 a.m. 28.1%
– Worked outside county of residence: 68.9%
– Means of transportation: drove alone (79.4%), carpooled (13.7%), walked to work (2.0%), public transportation (0.0%), worked from home (4.5%)
Nyttend // Wikimedia Commons
#25. Breathitt County
– Average Commute Time: 30.7 minutes
— 7.0 minutes longer than state average
– Workers with 60+ minute commute: 16.9%
– Left for work from 12 a.m. to 6 a.m. 19.3%
– Worked outside county of residence: 42.3%
– Means of transportation: drove alone (83.8%), carpooled (10.1%), walked to work (2.8%), public transportation (0.0%), worked from home (1.9%)
Nyttend // Wikimedia Commons
#24. Clay County
– Average Commute Time: 31.3 minutes
— 7.6 minutes longer than state average
– Workers with 60+ minute commute: 13.7%
– Left for work from 12 a.m. to 6 a.m. 17.5%
– Worked outside county of residence: 35.0%
– Means of transportation: drove alone (75.3%), carpooled (15.5%), walked to work (1.6%), public transportation (0.2%), worked from home (5.9%)
CoryClaxon // Wikimedia Commons
#23. Carter County
– Average Commute Time: 31.4 minutes
— 7.7 minutes longer than state average
– Workers with 60+ minute commute: 8.9%
– Left for work from 12 a.m. to 6 a.m. 17.7%
– Worked outside county of residence: 39.6%
– Means of transportation: drove alone (79.4%), carpooled (14.4%), walked to work (2.6%), public transportation (0.0%), worked from home (2.8%)
Kybluegrass // Wikimedia Commons
#22. McCreary County
– Average Commute Time: 31.6 minutes
— 7.9 minutes longer than state average
– Workers with 60+ minute commute: 13.9%
– Left for work from 12 a.m. to 6 a.m. 20.5%
– Worked outside county of residence: 34.0%
– Means of transportation: drove alone (83.7%), carpooled (10.6%), walked to work (2.3%), public transportation (0.0%), worked from home (2.2%)
Nyttend // Wikimedia Commons
#21. Spencer County
– Average Commute Time: 32.4 minutes
— 8.7 minutes longer than state average
– Workers with 60+ minute commute: 8.1%
– Left for work from 12 a.m. to 6 a.m. 20.2%
– Worked outside county of residence: 74.1%
– Means of transportation: drove alone (83.9%), carpooled (7.9%), walked to work (0.5%), public transportation (0.1%), worked from home (6.7%)
Nyttend // Wikimedia Commons
#20. Powell County
– Average Commute Time: 32.4 minutes
— 8.7 minutes longer than state average
– Workers with 60+ minute commute: 18.1%
– Left for work from 12 a.m. to 6 a.m. 18.8%
– Worked outside county of residence: 53.0%
– Means of transportation: drove alone (86.8%), carpooled (9.9%), walked to work (0.9%), public transportation (0.1%), worked from home (2.1%)
Nyttend // Wikimedia Commons
#19. Estill County
– Average Commute Time: 32.5 minutes
— 8.8 minutes longer than state average
– Workers with 60+ minute commute: 18.7%
– Left for work from 12 a.m. to 6 a.m. 18.1%
– Worked outside county of residence: 56.3%
– Means of transportation: drove alone (77.2%), carpooled (17.4%), walked to work (3.2%), public transportation (0.0%), worked from home (2.0%)
JERRYE & ROY KLOTZ MD // Wikimedia Commons
#18. Owsley County
– Average Commute Time: 32.6 minutes
— 8.9 minutes longer than state average
– Workers with 60+ minute commute: 17.2%
– Left for work from 12 a.m. to 6 a.m. 15.3%
– Worked outside county of residence: 42.0%
– Means of transportation: drove alone (80.9%), carpooled (11.7%), walked to work (2.1%), public transportation (0.0%), worked from home (2.8%)
Nyttend // Wikimedia Commons
#17. Meade County
– Average Commute Time: 32.7 minutes
— 9.0 minutes longer than state average
– Workers with 60+ minute commute: 14.1%
– Left for work from 12 a.m. to 6 a.m. 20.6%
– Worked outside county of residence: 60.5%
– Means of transportation: drove alone (84.3%), carpooled (9.2%), walked to work (1.3%), public transportation (0.4%), worked from home (4.1%)
Nyttend // Wikimedia Commons
#16. Magoffin County
– Average Commute Time: 33.4 minutes
— 9.7 minutes longer than state average
– Workers with 60+ minute commute: 15.2%
– Left for work from 12 a.m. to 6 a.m. 17.9%
– Worked outside county of residence: 47.6%
– Means of transportation: drove alone (85.9%), carpooled (8.8%), walked to work (3.0%), public transportation (0.5%), worked from home (1.7%)
Huw Williams (Huwmanbeing) // Wikimedia Commons
#15. Edmonson County
– Average Commute Time: 33.6 minutes
— 9.9 minutes longer than state average
– Workers with 60+ minute commute: 11.2%
– Left for work from 12 a.m. to 6 a.m. 26.5%
– Worked outside county of residence: 64.9%
– Means of transportation: drove alone (78.0%), carpooled (11.2%), walked to work (4.7%), public transportation (0.0%), worked from home (3.2%)
Hunter Hawley // Wikimedia Commons
#14. Breckinridge County
– Average Commute Time: 33.8 minutes
— 10.1 minutes longer than state average
– Workers with 60+ minute commute: 19.5%
– Left for work from 12 a.m. to 6 a.m. 29.7%
– Worked outside county of residence: 42.4%
– Means of transportation: drove alone (79.3%), carpooled (11.7%), walked to work (1.3%), public transportation (0.8%), worked from home (4.7%)
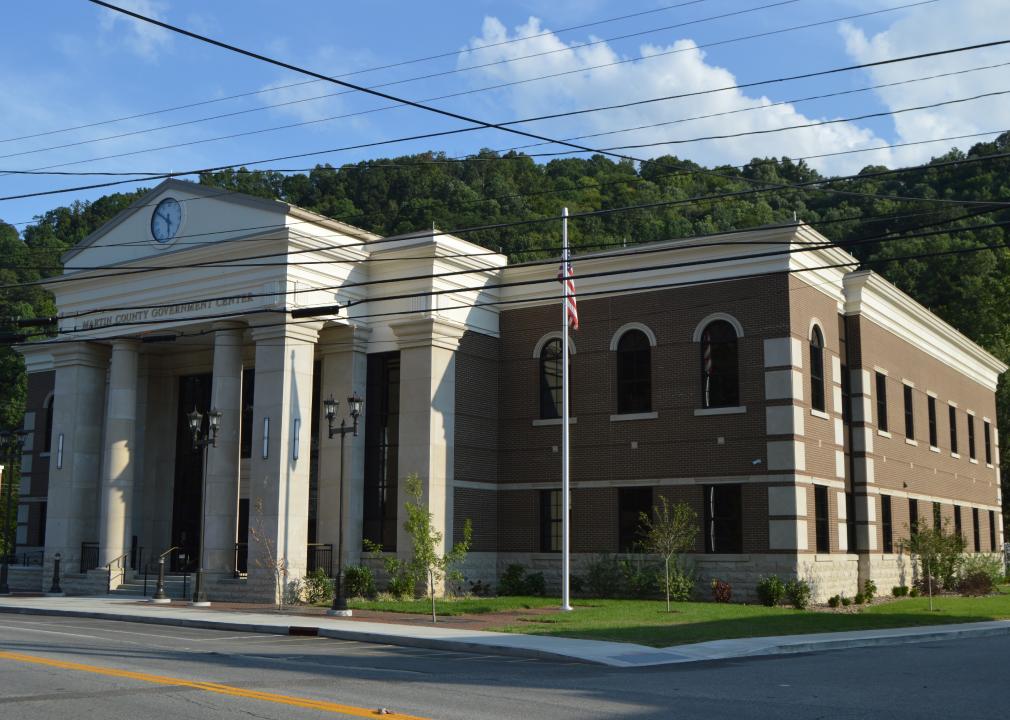
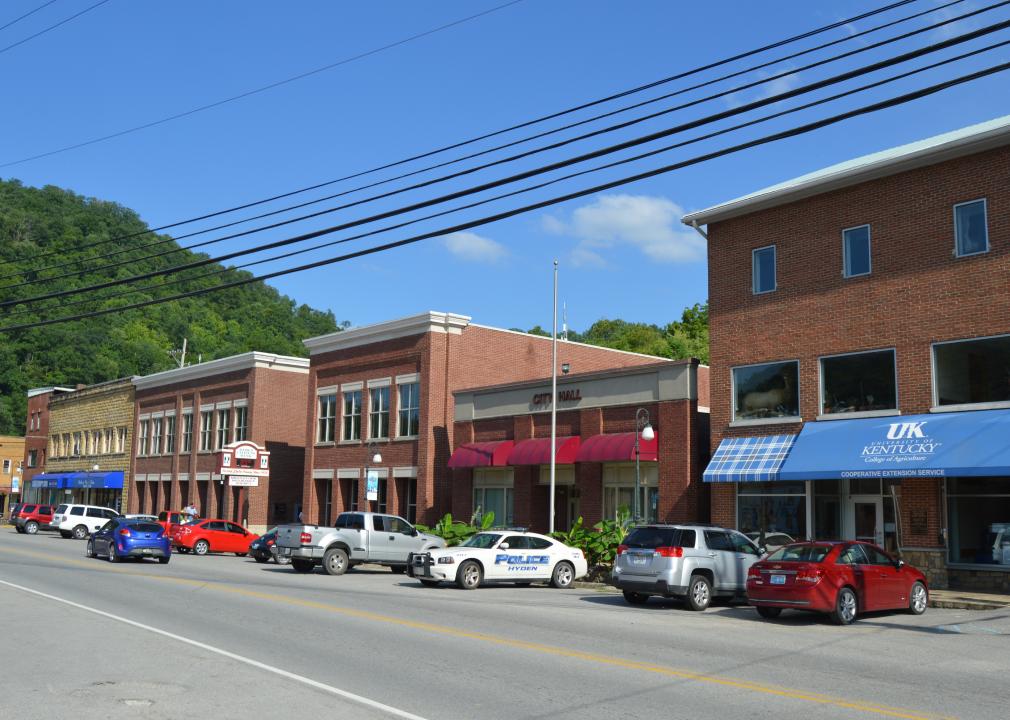
Nyttend // Wikimedia Commons
#13. Martin County
– Average Commute Time: 33.9 minutes
— 10.2 minutes longer than state average
– Workers with 60+ minute commute: 17.0%
– Left for work from 12 a.m. to 6 a.m. 17.2%
– Worked outside county of residence: 15.7%
– Means of transportation: drove alone (87.2%), carpooled (11.2%), walked to work (0.6%), public transportation (0.0%), worked from home (1.0%)
W.marsh // Wikimedia Commons
#12. Garrard County
– Average Commute Time: 34.9 minutes
— 11.2 minutes longer than state average
– Workers with 60+ minute commute: 16.4%
– Left for work from 12 a.m. to 6 a.m. 21.2%
– Worked outside county of residence: 70.8%
– Means of transportation: drove alone (83.1%), carpooled (9.6%), walked to work (0.2%), public transportation (0.1%), worked from home (6.5%)
Nyttend // Wikimedia Commons
#11. Bracken County
– Average Commute Time: 35.3 minutes
— 11.6 minutes longer than state average
– Workers with 60+ minute commute: 23.9%
– Left for work from 12 a.m. to 6 a.m. 19.6%
– Worked outside county of residence: 53.1%
– Means of transportation: drove alone (76.4%), carpooled (17.4%), walked to work (1.9%), public transportation (0.2%), worked from home (3.1%)
W.marsh // Wikimedia Commons
#10. Jackson County
– Average Commute Time: 35.4 minutes
— 11.7 minutes longer than state average
– Workers with 60+ minute commute: 19.7%
– Left for work from 12 a.m. to 6 a.m. 21.1%
– Worked outside county of residence: 52.0%
– Means of transportation: drove alone (77.4%), carpooled (11.6%), walked to work (4.2%), public transportation (1.2%), worked from home (5.0%)
W.marsh // Wikimedia Commons
#9. Pendleton County
– Average Commute Time: 37.2 minutes
— 13.5 minutes longer than state average
– Workers with 60+ minute commute: 16.0%
– Left for work from 12 a.m. to 6 a.m. 21.6%
– Worked outside county of residence: 59.4%
– Means of transportation: drove alone (84.9%), carpooled (7.8%), walked to work (1.5%), public transportation (0.7%), worked from home (4.8%)
Nyttend // Wikimedia Commons
#8. Leslie County
– Average Commute Time: 38.1 minutes
— 14.4 minutes longer than state average
– Workers with 60+ minute commute: 22.2%
– Left for work from 12 a.m. to 6 a.m. 24.3%
– Worked outside county of residence: 53.5%
– Means of transportation: drove alone (85.8%), carpooled (11.5%), walked to work (0.8%), public transportation (0.0%), worked from home (1.8%)
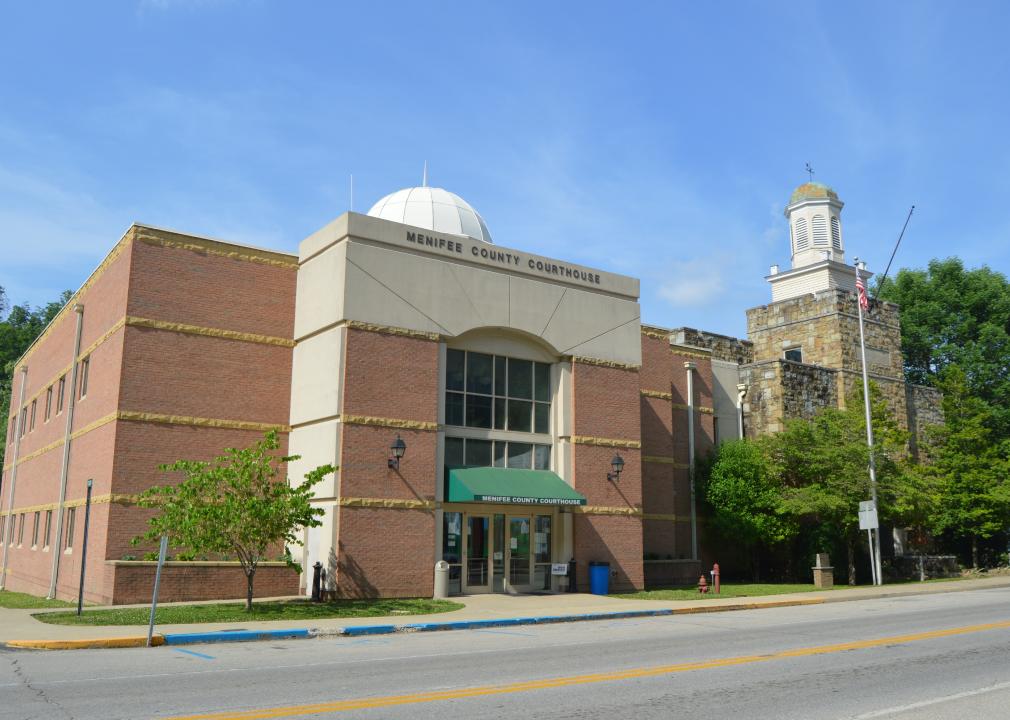
Nyttend // Wikimedia Commons
#7. Menifee County
– Average Commute Time: 38.5 minutes
— 14.8 minutes longer than state average
– Workers with 60+ minute commute: 17.2%
– Left for work from 12 a.m. to 6 a.m. 20.4%
– Worked outside county of residence: 61.9%
– Means of transportation: drove alone (80.0%), carpooled (10.3%), walked to work (0.5%), public transportation (0.0%), worked from home (9.2%)
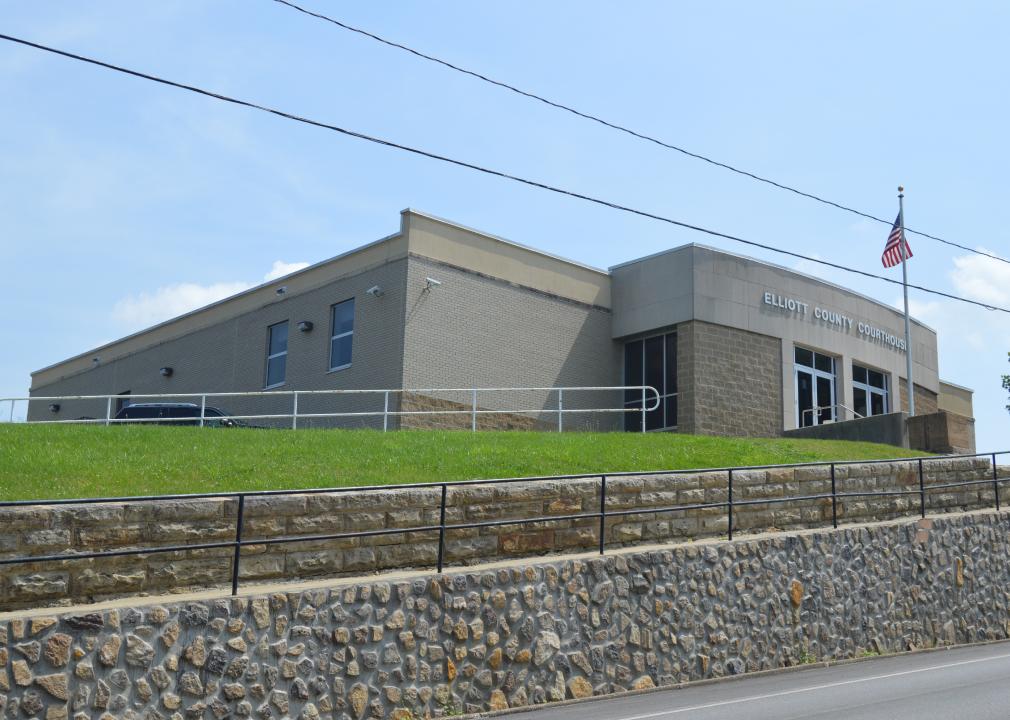
Nyttend // Wikimedia Commons
#6. Elliott County
– Average Commute Time: 39 minutes
— 15.3 minutes longer than state average
– Workers with 60+ minute commute: 21.6%
– Left for work from 12 a.m. to 6 a.m. 20.6%
– Worked outside county of residence: 58.9%
– Means of transportation: drove alone (81.7%), carpooled (15.0%), walked to work (1.3%), public transportation (0.3%), worked from home (1.2%)
Nyttend // Wikimedia Commons
#5. Nicholas County
– Average Commute Time: 41 minutes
— 17.3 minutes longer than state average
– Workers with 60+ minute commute: 24.2%
– Left for work from 12 a.m. to 6 a.m. 20.3%
– Worked outside county of residence: 68.0%
– Means of transportation: drove alone (80.1%), carpooled (13.4%), walked to work (2.9%), public transportation (0.5%), worked from home (3.0%)
W.marsh // Wikimedia Commons
#4. Owen County
– Average Commute Time: 41.2 minutes
— 17.5 minutes longer than state average
– Workers with 60+ minute commute: 19.9%
– Left for work from 12 a.m. to 6 a.m. 20.5%
– Worked outside county of residence: 60.3%
– Means of transportation: drove alone (75.5%), carpooled (14.3%), walked to work (2.7%), public transportation (0.0%), worked from home (7.3%)
W.marsh // Wikimedia Commons
#3. Robertson County
– Average Commute Time: 41.2 minutes
— 17.5 minutes longer than state average
– Workers with 60+ minute commute: 20.8%
– Left for work from 12 a.m. to 6 a.m. 25.6%
– Worked outside county of residence: 49.8%
– Means of transportation: drove alone (90.0%), carpooled (4.4%), walked to work (1.2%), public transportation (0.0%), worked from home (4.4%)
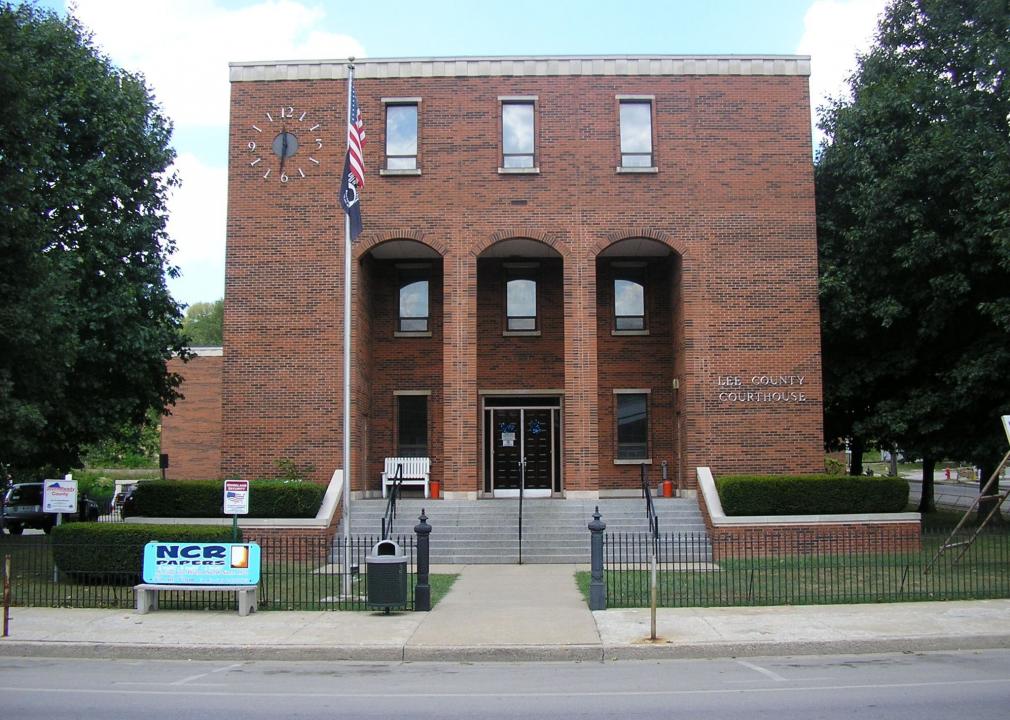
W.marsh // Wikimedia Commons
#2. Lee County
– Average Commute Time: 44.1 minutes
— 20.4 minutes longer than state average
– Workers with 60+ minute commute: 29.0%
– Left for work from 12 a.m. to 6 a.m. 26.6%
– Worked outside county of residence: 49.6%
– Means of transportation: drove alone (80.3%), carpooled (9.8%), walked to work (4.3%), public transportation (0.0%), worked from home (3.1%)
C. Bedford Crenshaw // Wikimedia Commons
#1. Lewis County
– Average Commute Time: 46 minutes
— 22.3 minutes longer than state average
– Workers with 60+ minute commute: 26.9%
– Left for work from 12 a.m. to 6 a.m. 23.4%
– Worked outside county of residence: 43.0%
– Means of transportation: drove alone (78.2%), carpooled (11.8%), walked to work (0.3%), public transportation (0.0%), worked from home (8.5%)


