Counties in Kentucky with the most pre-war homes
Published 1:05 pm Wednesday, June 22, 2022
Nyttend // Wikimedia Commons
Counties in Kentucky with the most pre-war homes
Pre-war homes—those built before 1939—are architectural gems. They are sturdy, charming, and often what people are referring to when they look at the prevalent colorless, linear designs of today and lament “they just don’t make them like they used to.”
In some ways, that’s a good thing. Pre-war homes often contained materials we know to be hazardous today, like asbestos and lead. But their signature characteristics, including hardwood floors, nickel accents, ornate crown molding, and high ceilings, are among the features many people look for in a dream home.
Preserving the history of these properties, many of which you’ll find on the National Register of Historic Places, is labor that often extends beyond the scope of an individual homeowner. Depending on where these homes are located, special permission by local historic commissions may be required before renovations can be done in an effort to preserve their historic architectural integrity.
Stacker compiled a list of counties in Kentucky with the most pre-war homes using data from the U.S. Census Bureau. Counties are ranked by the highest percent of homes that were built before 1939 based on 2020 5-year estimates.
You may also like: Most popular girl names in the 70s in Kentucky
![]()

W.marsh // Wikimedia Commons
#30. Woodford County
– Homes built before 1939: 11.3%
– Homes built since 2000: 18.8%
– Median year built: 1984
– Total homes: 11,230

FloNight (Sydney Poore) and Russell Poore // Wikimedia Commons
#29. Lincoln County
– Homes built before 1939: 11.7%
– Homes built since 2000: 24.7%
– Median year built: 1984
– Total homes: 11,055

Christopher L. Riley // Wikimedia Commons
#28. Boyle County
– Homes built before 1939: 11.8%
– Homes built since 2000: 17.0%
– Median year built: 1977
– Total homes: 12,517

Nyttend // Wikimedia Commons
#27. Carlisle County
– Homes built before 1939: 12.0%
– Homes built since 2000: 14.0%
– Median year built: 1977
– Total homes: 2,471

W.marsh // Wikimedia Commons
#26. Owen County
– Homes built before 1939: 12.1%
– Homes built since 2000: 18.6%
– Median year built: 1984
– Total homes: 5,753
You may also like: Counties with the highest COVID-19 death rate in Kentucky

Jim.henderson // Wikimedia Commons
#25. Hopkins County
– Homes built before 1939: 12.4%
– Homes built since 2000: 14.4%
– Median year built: 1976
– Total homes: 21,490

W.marsh // Wikimedia Commons
#24. Larue County
– Homes built before 1939: 12.6%
– Homes built since 2000: 20.6%
– Median year built: 1983
– Total homes: 6,403

Nyttend // Wikimedia Commons
#23. Green County
– Homes built before 1939: 12.6%
– Homes built since 2000: 15.0%
– Median year built: 1976
– Total homes: 5,337

Brian Stansberry // Wikimedia Commons
#22. Washington County
– Homes built before 1939: 12.9%
– Homes built since 2000: 29.2%
– Median year built: 1988
– Total homes: 5,206

Nyttend // Wikimedia Commons
#21. Estill County
– Homes built before 1939: 12.9%
– Homes built since 2000: 11.2%
– Median year built: 1978
– Total homes: 6,929
You may also like: Highest-earning counties in Kentucky

Nyttend // Wikimedia Commons
#20. Letcher County
– Homes built before 1939: 13.1%
– Homes built since 2000: 17.0%
– Median year built: 1978
– Total homes: 11,808

w:User:Malepheasant // Wikimedia Commons
#19. Boyd County
– Homes built before 1939: 13.3%
– Homes built since 2000: 8.8%
– Median year built: 1970
– Total homes: 21,649

Bedford // Wikimedia Commons
#18. Logan County
– Homes built before 1939: 13.7%
– Homes built since 2000: 11.5%
– Median year built: 1974
– Total homes: 12,361

Nyttend // Wikimedia Commons
#17. McLean County
– Homes built before 1939: 14.3%
– Homes built since 2000: 11.5%
– Median year built: 1976
– Total homes: 4,285

W.marsh // Wikimedia Commons
#16. Harlan County
– Homes built before 1939: 14.3%
– Homes built since 2000: 11.2%
– Median year built: 1975
– Total homes: 13,583
You may also like: The Black homeownership gap in Kentucky

Chris Watson // Wikicommons
#15. Jefferson County
– Homes built before 1939: 14.5%
– Homes built since 2000: 14.9%
– Median year built: 1969
– Total homes: 347,172

Patricia Drury // Wikimedia Commons
#14. Union County
– Homes built before 1939: 15.5%
– Homes built since 2000: 10.9%
– Median year built: 1974
– Total homes: 6,246

Nyttend // Wikimedia Commons
#13. Henry County
– Homes built before 1939: 15.6%
– Homes built since 2000: 19.1%
– Median year built: 1977
– Total homes: 6,791

W.marsh // Wikimedia Commons
#12. Pendleton County
– Homes built before 1939: 15.7%
– Homes built since 2000: 20.7%
– Median year built: 1982
– Total homes: 6,381

Bedford // Wikimedia Commons
#11. Webster County
– Homes built before 1939: 16.2%
– Homes built since 2000: 11.1%
– Median year built: 1974
– Total homes: 5,979
You may also like: Recipes from Kentucky

Greg5030 // Wikimedia Commons
#10. Mason County
– Homes built before 1939: 16.5%
– Homes built since 2000: 18.5%
– Median year built: 1973
– Total homes: 8,168

Smceuen // Wikimedia Commons
#9. Carroll County
– Homes built before 1939: 17.1%
– Homes built since 2000: 15.5%
– Median year built: 1984
– Total homes: 4,730

Brian Stansberry // Wikimedia Commons
#8. Harrison County
– Homes built before 1939: 17.3%
– Homes built since 2000: 21.9%
– Median year built: 1982
– Total homes: 8,315

Nyttend // Wikimedia Commons
#7. Mercer County
– Homes built before 1939: 18.7%
– Homes built since 2000: 14.1%
– Median year built: 1975
– Total homes: 10,195

W.marsh // Wikimedia Commons
#6. Bourbon County
– Homes built before 1939: 19.7%
– Homes built since 2000: 20.7%
– Median year built: 1975
– Total homes: 9,085
You may also like: What Kentucky’s immigrant population looked like in 1900

Greg5030 // Wikimedia Commons
#5. Kenton County
– Homes built before 1939: 20.4%
– Homes built since 2000: 15.8%
– Median year built: 1973
– Total homes: 69,790

Nyttend // Wikimedia Commons
#4. Nicholas County
– Homes built before 1939: 24.1%
– Homes built since 2000: 15.4%
– Median year built: 1973
– Total homes: 3,293

W.marsh // Wikimedia Commons
#3. Robertson County
– Homes built before 1939: 24.8%
– Homes built since 2000: 20.9%
– Median year built: 1969
– Total homes: 1,106

Rdikeman // Wikimedia Commons
#2. Campbell County
– Homes built before 1939: 27.6%
– Homes built since 2000: 15.9%
– Median year built: 1968
– Total homes: 40,533

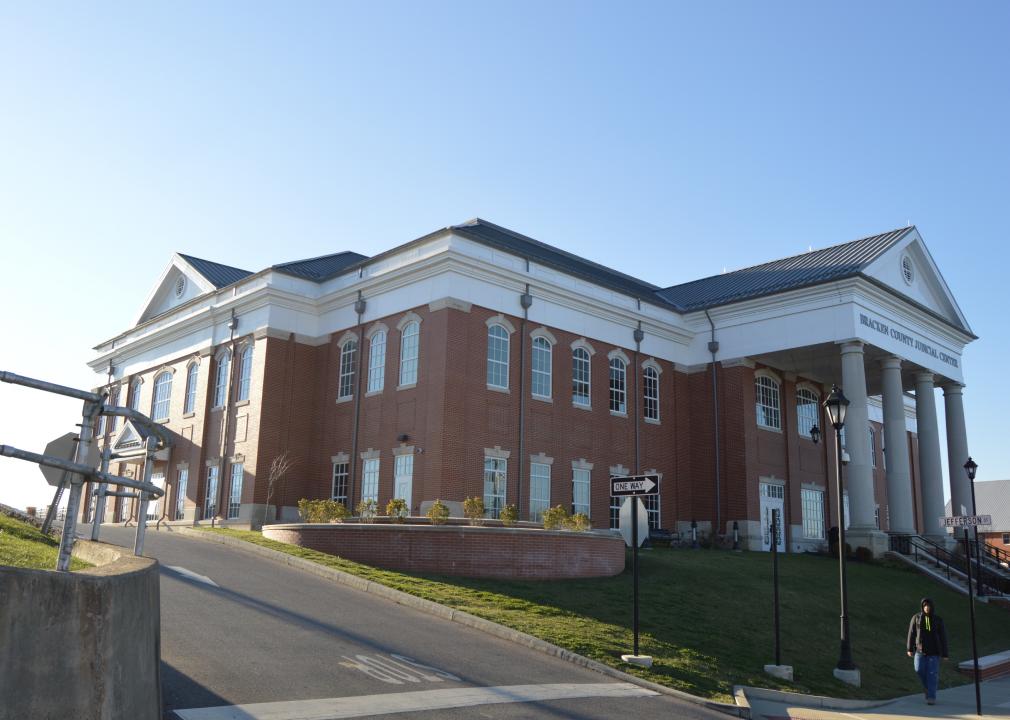
Nyttend // Wikimedia Commons
#1. Bracken County
– Homes built before 1939: 29.3%
– Homes built since 2000: 18.2%
– Median year built: 1972
– Total homes: 3,860
You may also like: Too much rain: How climate change has affected Kentucky


