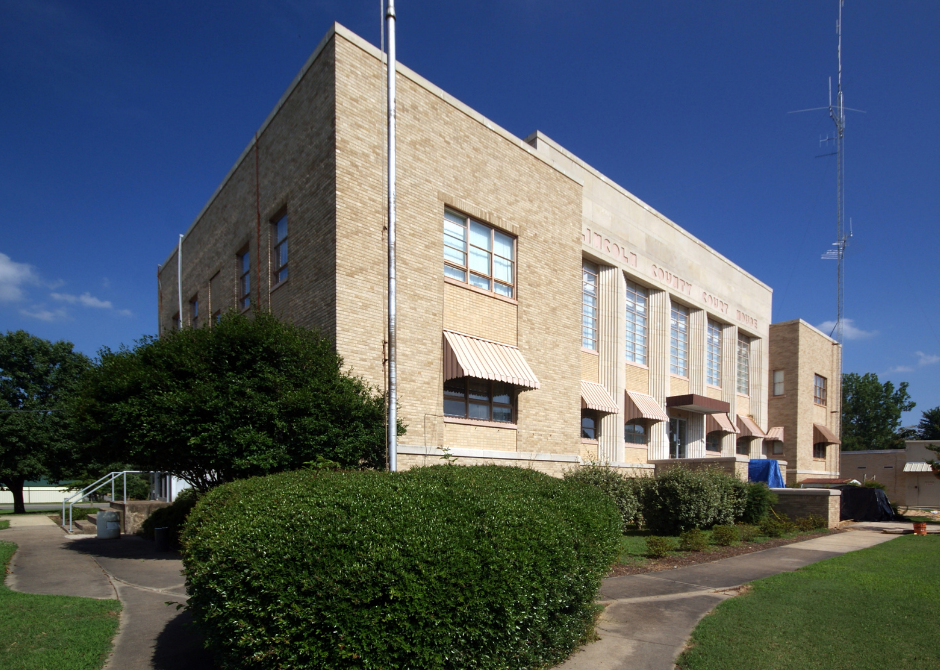
Counties with the highest unemployment rate in Kentucky
Published 12:32 pm Wednesday, June 15, 2022
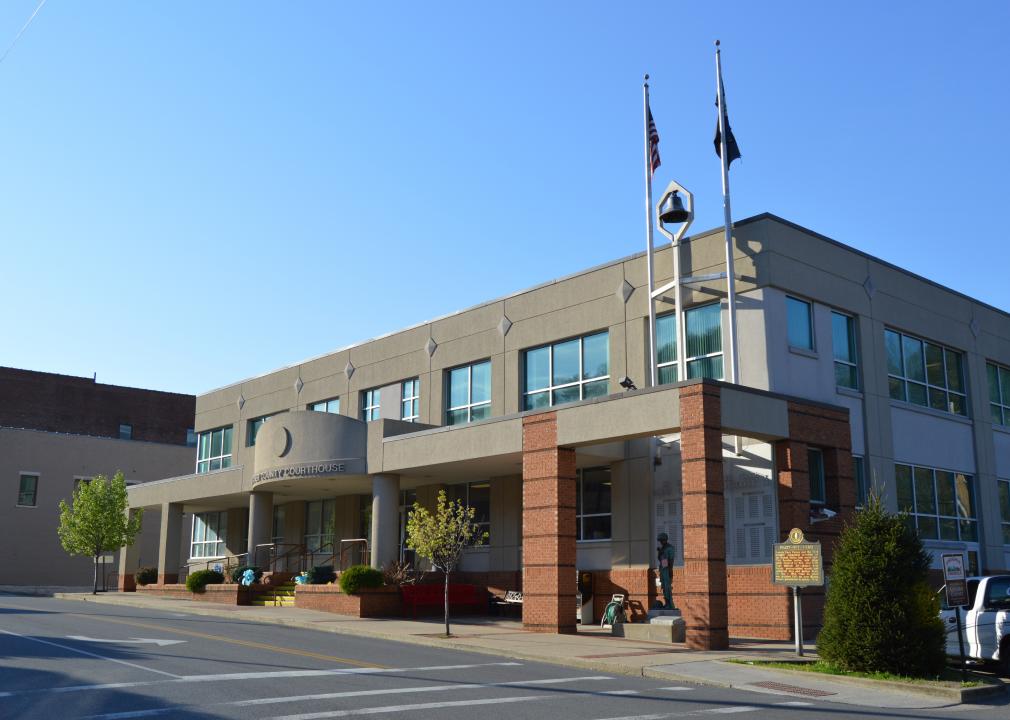
Nyttend // Wikimedia Commons
Counties with the highest unemployment rate in Kentucky
Unemployment rates, while significantly lower than the alarming pandemic peak of 14.7% experienced in April 2020, remain a subject of concern, notably as economic experts bandy around the idea of a potential recession by 2023. The last economic recession—the Great Recession of 2008-2010—sent rates up to 10% as of October 2009. It was not until the spring of 2019 that unemployment finally went down to the same level it sits at now.
As of May of this year, national unemployment is at 3.6%—as it was in both March and April, marking a three-month stagnation—following a steady drop since that aforementioned COVID-affected peak. Seasonally adjusted unemployment rates by state demonstrate a rather sizable spectrum, ranging from just 1.9% in Nebraska and Utah, to 5.3% in New Mexico and 5.8% in the District of Columbia. Further breakdown by the U.S. Bureau of Labor Statistics shows yet another county-based spectrum within each state.
To that end, Stacker compiled a list of counties with the highest unemployment rate in Kentucky using data from the BLS. Counties are ranked by unemployment rate in April 2022, which as of this writing is the most current Bureau data.
You may also like: Counties with the oldest homes in Kentucky
![]()

Photolitherland // Wikicommons
#50. Pulaski County
– Current unemployment rate: 3.90%
— 1 month change: -0.6%
— 1 year change: -0.4%
– Total labor force: 25,643 (1,000 unemployed)
Huw Williams (Huwmanbeing) // Wikimedia Commons
#49. Edmonson County
– Current unemployment rate: 3.97%
— 1 month change: -1.1%
— 1 year change: -0.5%
– Total labor force: 4,731 (188 unemployed)
Hunter Hawley // Wikimedia Commons
#48. Breckinridge County
– Current unemployment rate: 3.98%
— 1 month change: -0.8%
— 1 year change: -0.8%
– Total labor force: 7,907 (315 unemployed)
Paul Sableman // Wikimedia Commons
#47. Graves County
– Current unemployment rate: 4.00%
— 1 month change: -0.6%
— 1 year change: 0.0%
– Total labor force: 15,707 (629 unemployed)
Jim.henderson // Wikimedia Commons
#46. Hopkins County
– Current unemployment rate: 4.04%
— 1 month change: -0.5%
— 1 year change: -0.4%
– Total labor force: 18,174 (734 unemployed)
You may also like: Best school districts in Kentucky
FloNight (Sydney Poore) and Russell Poore // Wikimedia Commons
#45. Fleming County
– Current unemployment rate: 4.05%
— 1 month change: -0.4%
— 1 year change: -0.1%
– Total labor force: 5,922 (240 unemployed)
Nyttend // Wikimedia Commons
#44. Estill County
– Current unemployment rate: 4.10%
— 1 month change: -0.8%
— 1 year change: -0.4%
– Total labor force: 5,216 (214 unemployed)
Rivers Langley SaveRivers // Wikimedia Commons
#43. Russell County
– Current unemployment rate: 4.12%
— 1 month change: -1.0%
— 1 year change: -0.7%
– Total labor force: 6,065 (250 unemployed)

Chris Pruitt // wikicommons
#42. Montgomery County
– Current unemployment rate: 4.16%
— 1 month change: -0.7%
— 1 year change: -0.4%
– Total labor force: 11,772 (490 unemployed)
W.marsh // Wikimedia Commons
#41. Robertson County
– Current unemployment rate: 4.19%
— 1 month change: -1.6%
— 1 year change: 0.7%
– Total labor force: 787 (33 unemployed)
You may also like: Least educated counties in Kentucky
Canva
#40. Wayne County
– Current unemployment rate: 4.22%
— 1 month change: -0.6%
— 1 year change: -0.2%
– Total labor force: 7,015 (296 unemployed)
Canva
#39. Lincoln County
– Current unemployment rate: 4.24%
— 1 month change: -0.5%
— 1 year change: -0.8%
– Total labor force: 9,279 (393 unemployed)
Huw Williams (Huwmanbeing) // Wikimedia Commons
#38. Grayson County
– Current unemployment rate: 4.24%
— 1 month change: -0.8%
— 1 year change: -0.9%
– Total labor force: 10,534 (447 unemployed)
Canva
#37. Mason County
– Current unemployment rate: 4.25%
— 1 month change: -0.6%
— 1 year change: -0.6%
– Total labor force: 6,653 (283 unemployed)
Nyttend // Wikimedia Commons
#36. Bell County
– Current unemployment rate: 4.28%
— 1 month change: -0.8%
— 1 year change: -0.8%
– Total labor force: 8,301 (355 unemployed)
You may also like: Zip codes with the most expensive homes in Kentucky
Brandonrush // Wikimedia Commons
#35. Fulton County
– Current unemployment rate: 4.33%
— 1 month change: -0.2%
— 1 year change: -0.5%
– Total labor force: 2,057 (89 unemployed)
Nyttend // Wikimedia Commons
#34. Metcalfe County
– Current unemployment rate: 4.34%
— 1 month change: -0.4%
— 1 year change: -0.7%
– Total labor force: 3,896 (169 unemployed)
MPearsallArt // Wikimedia Commons
#33. Morgan County
– Current unemployment rate: 4.36%
— 1 month change: -1.2%
— 1 year change: -0.4%
– Total labor force: 4,311 (188 unemployed)
Warren LeMay from Cullowhee, NC, United States // Wikimedia Commons
#32. Ohio County
– Current unemployment rate: 4.37%
— 1 month change: -0.6%
— 1 year change: -0.5%
– Total labor force: 8,877 (388 unemployed)
W.marsh // Wikimedia Commons
#31. Rowan County
– Current unemployment rate: 4.49%
— 1 month change: -0.1%
— 1 year change: -0.5%
– Total labor force: 10,013 (450 unemployed)
You may also like: Famous actresses from Kentucky
Kybluegrass // Wikimedia Commons
#30. McCreary County
– Current unemployment rate: 4.53%
— 1 month change: -0.6%
— 1 year change: -0.5%
– Total labor force: 4,788 (217 unemployed)
Nyttend // Wikimedia Commons
#29. Wolfe County
– Current unemployment rate: 4.60%
— 1 month change: -0.7%
— 1 year change: -0.2%
– Total labor force: 2,262 (104 unemployed)
Canva
#28. Christian County
– Current unemployment rate: 4.60%
— 1 month change: -0.1%
— 1 year change: -0.6%
– Total labor force: 25,101 (1,155 unemployed)
w:User:Malepheasant // Wikimedia Commons
#27. Boyd County
– Current unemployment rate: 4.61%
— 1 month change: -0.8%
— 1 year change: -1.0%
– Total labor force: 17,524 (807 unemployed)
Canva
#26. Perry County
– Current unemployment rate: 4.61%
— 1 month change: -0.7%
— 1 year change: -0.9%
– Total labor force: 8,065 (372 unemployed)
You may also like: 17% of people live near toxic release facilities—here’s how it breaks down in Kentucky
Library of Congress
#25. Lee County
– Current unemployment rate: 4.69%
— 1 month change: -0.9%
— 1 year change: 0.0%
– Total labor force: 2,049 (96 unemployed)
IvoShandor // Wikimedia Commons
#24. Livingston County
– Current unemployment rate: 4.72%
— 1 month change: -0.8%
— 1 year change: -0.6%
– Total labor force: 3,581 (169 unemployed)
Canva
#23. Knox County
– Current unemployment rate: 4.76%
— 1 month change: -0.4%
— 1 year change: -0.8%
– Total labor force: 10,342 (492 unemployed)
Kreeder13 // Wikimedia Commons
#22. Pike County
– Current unemployment rate: 4.82%
— 1 month change: -0.6%
— 1 year change: -1.1%
– Total labor force: 19,184 (925 unemployed)
Canva
#21. Lawrence County
– Current unemployment rate: 4.85%
— 1 month change: -0.7%
— 1 year change: -1.0%
– Total labor force: 5,486 (266 unemployed)
You may also like: Countries Kentucky imports the most goods from
Jonathunder // Wikimedia Commons
#20. Ballard County
– Current unemployment rate: 4.87%
— 1 month change: -0.2%
— 1 year change: 0.5%
– Total labor force: 3,429 (167 unemployed)
W.marsh // Wikimedia Commons
#19. Bath County
– Current unemployment rate: 4.96%
— 1 month change: -0.5%
— 1 year change: -0.1%
– Total labor force: 4,637 (230 unemployed)
JNix // Shutterstock
#18. Clay County
– Current unemployment rate: 5.03%
— 1 month change: -0.4%
— 1 year change: -1.0%
– Total labor force: 5,188 (261 unemployed)
Springfieldohio // Wikimedia Commons
#17. Jackson County
– Current unemployment rate: 5.13%
— 1 month change: -0.6%
— 1 year change: -0.4%
– Total labor force: 4,173 (214 unemployed)
Megangen1990 // Wikimedia Commons
#16. Muhlenberg County
– Current unemployment rate: 5.18%
— 1 month change: -0.6%
— 1 year change: -0.8%
– Total labor force: 9,775 (506 unemployed)
You may also like: Countries Kentucky exports the most goods to
Turover // Wikimedia Commons
#15. Greenup County
– Current unemployment rate: 5.30%
— 1 month change: -0.9%
— 1 year change: -1.0%
– Total labor force: 13,156 (697 unemployed)
Nyttend // Wikimedia Commons
#14. Menifee County
– Current unemployment rate: 5.54%
— 1 month change: -0.8%
— 1 year change: -0.5%
– Total labor force: 2,347 (130 unemployed)
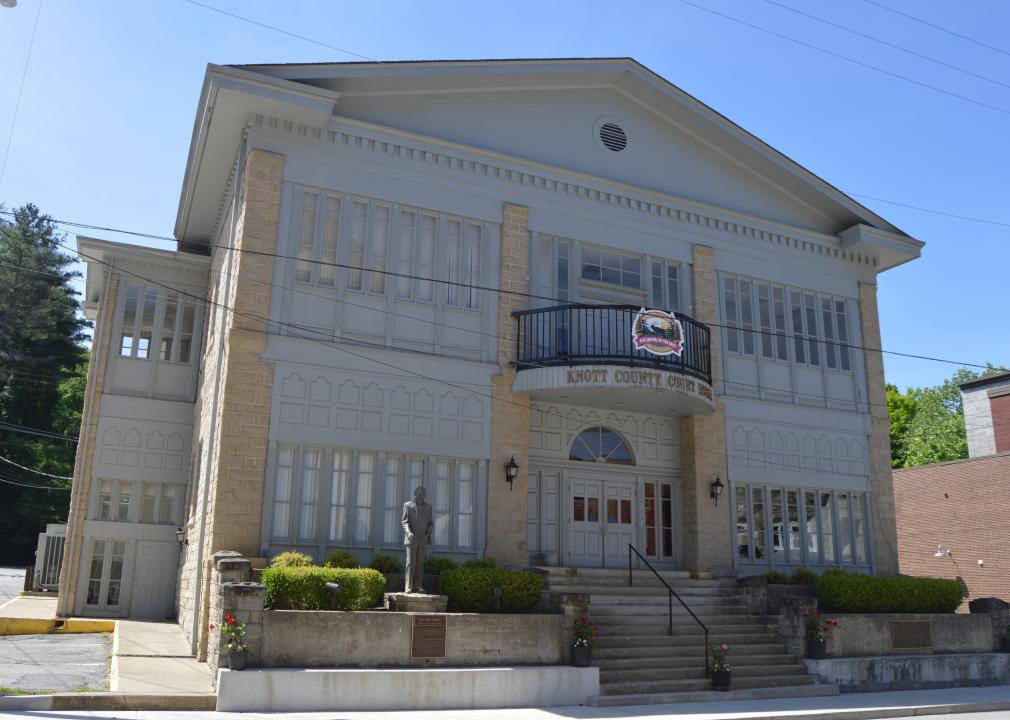
Nyttend // Wikimedia Commons
#13. Knott County
– Current unemployment rate: 5.56%
— 1 month change: -0.9%
— 1 year change: -0.6%
– Total labor force: 4,280 (238 unemployed)
Nyttend // Wikimedia Commons
#12. Letcher County
– Current unemployment rate: 5.61%
— 1 month change: -0.5%
— 1 year change: -1.1%
– Total labor force: 6,133 (344 unemployed)
Thomson200 // Wikimedia Commons
#11. Floyd County
– Current unemployment rate: 5.73%
— 1 month change: -0.6%
— 1 year change: -0.4%
– Total labor force: 11,107 (636 unemployed)
You may also like: Counties most concerned about climate change in Kentucky
Valis55 // Wikimedia Commons
#10. Johnson County
– Current unemployment rate: 5.73%
— 1 month change: -0.8%
— 1 year change: -0.9%
– Total labor force: 6,682 (383 unemployed)
W.marsh // Wikimedia Commons
#9. Harlan County
– Current unemployment rate: 6.19%
— 1 month change: -0.7%
— 1 year change: -1.7%
– Total labor force: 6,718 (416 unemployed)
rustejunk // Wikimedia Commons
#8. Lewis County
– Current unemployment rate: 6.44%
— 1 month change: -1.1%
— 1 year change: -0.3%
– Total labor force: 4,707 (303 unemployed)
CoryClaxon // Wikimedia Commons
#7. Carter County
– Current unemployment rate: 6.52%
— 1 month change: -1.1%
— 1 year change: -0.3%
– Total labor force: 9,780 (638 unemployed)
Nyttend // Wikimedia Commons
#6. Leslie County
– Current unemployment rate: 6.56%
— 1 month change: -0.5%
— 1 year change: -0.4%
– Total labor force: 2,544 (167 unemployed)
You may also like: Where people in Kentucky are moving to most
JERRYE & ROY KLOTZ MD // Wikimedia Commons
#5. Owsley County
– Current unemployment rate: 6.68%
— 1 month change: -0.2%
— 1 year change: 1.0%
– Total labor force: 1,048 (70 unemployed)
Canva
#4. Martin County
– Current unemployment rate: 7.31%
— 1 month change: -0.6%
— 1 year change: -1.0%
– Total labor force: 2,311 (169 unemployed)
Nyttend // Wikimedia Commons
#3. Elliott County
– Current unemployment rate: 7.54%
— 1 month change: -1.1%
— 1 year change: 1.0%
– Total labor force: 1,843 (139 unemployed)
Nyttend // Wikimedia Commons
#2. Breathitt County
– Current unemployment rate: 7.62%
— 1 month change: -1.1%
— 1 year change: 0.3%
– Total labor force: 3,269 (249 unemployed)
Nyttend // Wikimedia Commons
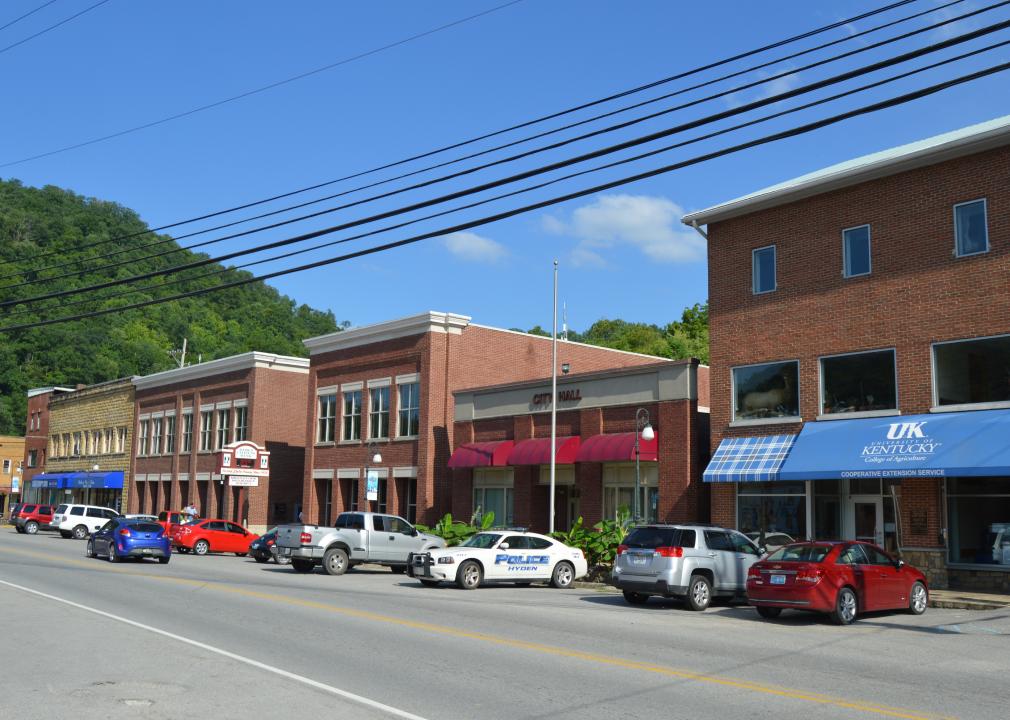
#1. Magoffin County
– Current unemployment rate: 10.54%
— 1 month change: -1.9%
— 1 year change: -0.4%
– Total labor force: 3,349 (353 unemployed)
You may also like: Most popular girl names in the 80s in Kentucky


