Fastest-growing counties in Kentucky
Published 1:38 pm Monday, December 6, 2021
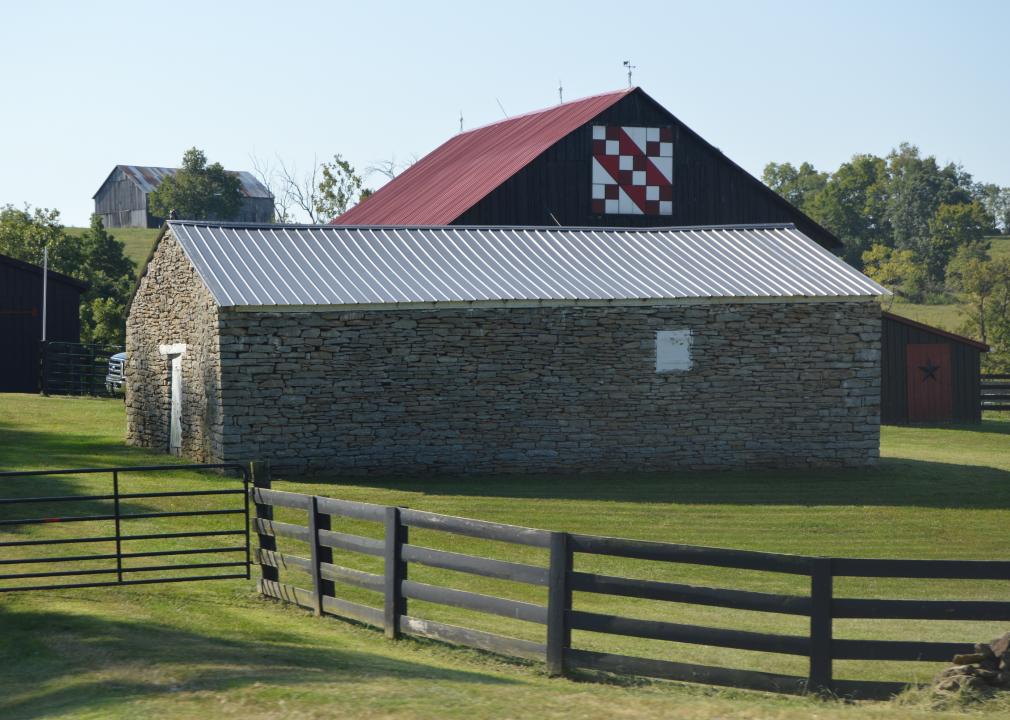
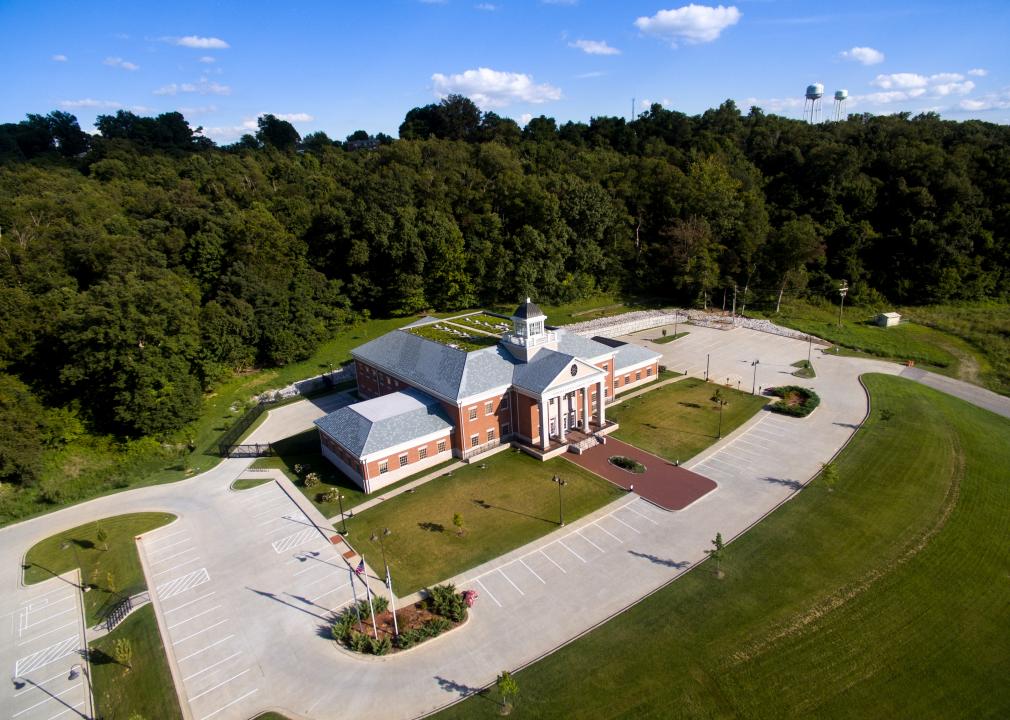
Chris Watson // Wikicommons
Fastest-growing counties in Kentucky
From 2019 to 2020, the U.S. population grew by .35%, its slowest rate since 1900. Declining births, increasing deaths largely due to the graying Baby Boomer population, and a crackdown on immigration have contributed to many states seeing net population losses in recent years.
But in other pockets of the country, populations are growing. These shifts can be due to job opportunities, high quality of life, easy commutability to job centers, low rents, or any combination of these or other factors. Stacker compiled a list of the fastest-growing counties in Kentucky using data from the U.S. Census Bureau. Counties are ranked by the highest population growth from 2010 to 2020.
A county typically sees population growth as a “bedroom community” (a municipality with an atypically large commuting population) to a large city. These communities are typically quieter than their feeder cities, offer lower rents and a higher quality of living, and are remote enough to be immune to the feeder city’s crime, traffic, and crowds. Keep reading to see if your home county made the list.
![]()
Nyttend // Wikimedia Commons
#50. Grant County
– 2010 to 2020 population change: 337
— #1,312 among all counties nationwide
– 2010 to 2020 percent population change: +1.4%
— #54 among counties in Kentucky, #1,383 among all counties nationwide
– 2020 population: 24,941
— #45 largest county in Kentucky, #1,606 largest county nationwide
Murray State // Wikimedia Commons
#49. Calloway County
– 2010 to 2020 population change: 340
— #1,311 among all counties nationwide
– 2010 to 2020 percent population change: +0.9%
— #57 among counties in Kentucky, #1,435 among all counties nationwide
– 2020 population: 37,103
— #26 largest county in Kentucky, #1,246 largest county nationwide
Nyttend // Wikimedia Commons
#48. Powell County
– 2010 to 2020 population change: 343
— #1,307 among all counties nationwide
– 2010 to 2020 percent population change: +2.7%
— #47 among counties in Kentucky, #1,195 among all counties nationwide
– 2020 population: 13,129
— #82 largest county in Kentucky, #2,205 largest county nationwide
W.marsh // Wikimedia Commons
#47. Owen County
– 2010 to 2020 population change: 350
— #1,302 among all counties nationwide
– 2010 to 2020 percent population change: +3.2%
— #42 among counties in Kentucky, #1,123 among all counties nationwide
– 2020 population: 11,278
— #95 largest county in Kentucky, #2,332 largest county nationwide
W.marsh // Wikimedia Commons
#46. Adair County
– 2010 to 2020 population change: 361
— #1,295 among all counties nationwide
– 2010 to 2020 percent population change: +1.9%
— #51 among counties in Kentucky, #1,296 among all counties nationwide
– 2020 population: 18,903
— #63 largest county in Kentucky, #1,876 largest county nationwide
Nyttend // Wikimedia Commons
#45. Nicholas County
– 2010 to 2020 population change: 401
— #1,277 among all counties nationwide
– 2010 to 2020 percent population change: +5.6%
— #29 among counties in Kentucky, #880 among all counties nationwide
– 2020 population: 7,537
— #110 largest county in Kentucky, #2,616 largest county nationwide
Brian Stansberry // Wikimedia Commons
#44. Washington County
– 2010 to 2020 population change: 434
— #1,265 among all counties nationwide
– 2010 to 2020 percent population change: +3.7%
— #39 among counties in Kentucky, #1,062 among all counties nationwide
– 2020 population: 12,027
— #91 largest county in Kentucky, #2,278 largest county nationwide
Nyttend // Wikimedia Commons
#43. Lawrence County
– 2010 to 2020 population change: 452
— #1,258 among all counties nationwide
– 2010 to 2020 percent population change: +2.9%
— #45 among counties in Kentucky, #1,179 among all counties nationwide
– 2020 population: 16,293
— #69 largest county in Kentucky, #2,017 largest county nationwide
Hunter Hawley // Wikimedia Commons
#42. Breckinridge County
– 2010 to 2020 population change: 539
— #1,216 among all counties nationwide
– 2010 to 2020 percent population change: +2.7%
— #46 among counties in Kentucky, #1,192 among all counties nationwide
– 2020 population: 20,432
— #55 largest county in Kentucky, #1,796 largest county nationwide
Ryan Emmick // Wikimedia Commons
#41. Hancock County
– 2010 to 2020 population change: 540
— #1,215 among all counties nationwide
– 2010 to 2020 percent population change: +6.3%
— #27 among counties in Kentucky, #824 among all counties nationwide
– 2020 population: 9,095
— #102 largest county in Kentucky, #2,483 largest county nationwide
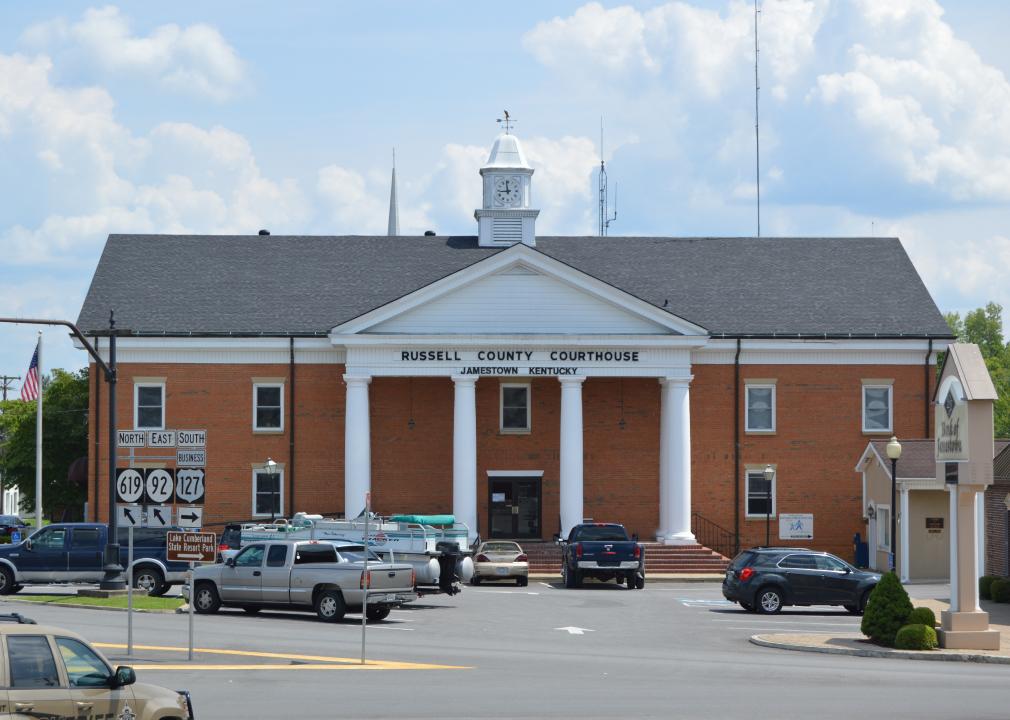
Nyttend // Wikimedia Commons
#40. Russell County
– 2010 to 2020 population change: 546
— #1,212 among all counties nationwide
– 2010 to 2020 percent population change: +3.1%
— #43 among counties in Kentucky, #1,135 among all counties nationwide
– 2020 population: 17,991
— #65 largest county in Kentucky, #1,916 largest county nationwide
Bedford // Wikimedia Commons
#39. Logan County
– 2010 to 2020 population change: 594
— #1,186 among all counties nationwide
– 2010 to 2020 percent population change: +2.2%
— #49 among counties in Kentucky, #1,267 among all counties nationwide
– 2020 population: 27,432
— #39 largest county in Kentucky, #1,512 largest county nationwide
No machine-readable author provided. Blinutne assumed (based on copyright claims). // Wikimedia Commons
#38. Whitley County
– 2010 to 2020 population change: 706
— #1,159 among all counties nationwide
– 2010 to 2020 percent population change: +2.0%
— #50 among counties in Kentucky, #1,293 among all counties nationwide
– 2020 population: 36,712
— #28 largest county in Kentucky, #1,264 largest county nationwide
FloNight (Sydney Poore) and Russell Poore // Wikimedia Commons
#37. Fleming County
– 2010 to 2020 population change: 764
— #1,141 among all counties nationwide
– 2010 to 2020 percent population change: +5.3%
— #31 among counties in Kentucky, #901 among all counties nationwide
– 2020 population: 15,082
— #73 largest county in Kentucky, #2,080 largest county nationwide
W.marsh // Wikimedia Commons
#36. Larue County
– 2010 to 2020 population change: 787
— #1,133 among all counties nationwide
– 2010 to 2020 percent population change: +5.6%
— #30 among counties in Kentucky, #883 among all counties nationwide
– 2020 population: 14,867
— #74 largest county in Kentucky, #2,091 largest county nationwide
Huw Williams (Huwmanbeing) // Wikimedia Commons
#35. Grayson County
– 2010 to 2020 population change: 880
— #1,110 among all counties nationwide
– 2010 to 2020 percent population change: +3.4%
— #41 among counties in Kentucky, #1,095 among all counties nationwide
– 2020 population: 26,420
— #43 largest county in Kentucky, #1,551 largest county nationwide
Nyttend // Wikimedia Commons
#34. Allen County
– 2010 to 2020 population change: 900
— #1,104 among all counties nationwide
– 2010 to 2020 percent population change: +4.6%
— #35 among counties in Kentucky, #975 among all counties nationwide
– 2020 population: 20,588
— #54 largest county in Kentucky, #1,784 largest county nationwide
JERRYE & ROY KLOTZ MD // Wikimedia Commons
#33. Hart County
– 2010 to 2020 population change: 1,087
— #1,062 among all counties nationwide
– 2010 to 2020 percent population change: +6.0%
— #28 among counties in Kentucky, #844 among all counties nationwide
– 2020 population: 19,288
— #62 largest county in Kentucky, #1,858 largest county nationwide
Nyttend // Wikimedia Commons
#32. Meade County
– 2010 to 2020 population change: 1,096
— #1,060 among all counties nationwide
– 2010 to 2020 percent population change: +3.8%
— #38 among counties in Kentucky, #1,058 among all counties nationwide
– 2020 population: 30,003
— #36 largest county in Kentucky, #1,434 largest county nationwide
W.marsh // Wikimedia Commons
#31. Bath County
– 2010 to 2020 population change: 1,185
— #1,038 among all counties nationwide
– 2010 to 2020 percent population change: +10.2%
— #13 among counties in Kentucky, #544 among all counties nationwide
– 2020 population: 12,750
— #86 largest county in Kentucky, #2,226 largest county nationwide
Nyttend // Wikimedia Commons
#30. Mercer County
– 2010 to 2020 population change: 1,369
— #1,000 among all counties nationwide
– 2010 to 2020 percent population change: +6.4%
— #26 among counties in Kentucky, #813 among all counties nationwide
– 2020 population: 22,641
— #52 largest county in Kentucky, #1,691 largest county nationwide
W.marsh // Wikimedia Commons
#29. Rowan County
– 2010 to 2020 population change: 1,587
— #957 among all counties nationwide
– 2010 to 2020 percent population change: +6.9%
— #24 among counties in Kentucky, #778 among all counties nationwide
– 2020 population: 24,662
— #46 largest county in Kentucky, #1,619 largest county nationwide
Christopher L. Riley // Wikimedia Commons
#28. Clark County
– 2010 to 2020 population change: 1,667
— #948 among all counties nationwide
– 2010 to 2020 percent population change: +4.7%
— #34 among counties in Kentucky, #965 among all counties nationwide
– 2020 population: 36,972
— #27 largest county in Kentucky, #1,252 largest county nationwide
Nyttend // Wikimedia Commons
#27. Taylor County
– 2010 to 2020 population change: 1,776
— #937 among all counties nationwide
– 2010 to 2020 percent population change: +7.3%
— #22 among counties in Kentucky, #743 among all counties nationwide
– 2020 population: 26,023
— #44 largest county in Kentucky, #1,557 largest county nationwide
W.marsh // Wikimedia Commons
#26. Montgomery County
– 2010 to 2020 population change: 2,206
— #868 among all counties nationwide
– 2010 to 2020 percent population change: +8.5%
— #17 among counties in Kentucky, #649 among all counties nationwide
– 2020 population: 28,114
— #38 largest county in Kentucky, #1,492 largest county nationwide
W.marsh // Wikimedia Commons
#25. Woodford County
– 2010 to 2020 population change: 2,348
— #846 among all counties nationwide
– 2010 to 2020 percent population change: +9.6%
— #16 among counties in Kentucky, #586 among all counties nationwide
– 2020 population: 26,871
— #40 largest county in Kentucky, #1,528 largest county nationwide
Christopher L. Riley // Wikimedia Commons
#24. Boyle County
– 2010 to 2020 population change: 2,369
— #843 among all counties nationwide
– 2010 to 2020 percent population change: +8.4%
— #18 among counties in Kentucky, #660 among all counties nationwide
– 2020 population: 30,614
— #34 largest county in Kentucky, #1,418 largest county nationwide
Bfreas // Wikimedia Commons
#23. Simpson County
– 2010 to 2020 population change: 2,380
— #842 among all counties nationwide
– 2010 to 2020 percent population change: +13.8%
— #7 among counties in Kentucky, #352 among all counties nationwide
– 2020 population: 19,594
— #58 largest county in Kentucky, #1,840 largest county nationwide
JERRYE & ROY KLOTZ MD // Wikimedia Commons
#22. Franklin County
– 2010 to 2020 population change: 2,474
— #828 among all counties nationwide
– 2010 to 2020 percent population change: +5.0%
— #32 among counties in Kentucky, #928 among all counties nationwide
– 2020 population: 51,541
— #19 largest county in Kentucky, #975 largest county nationwide
Smallbones // Wikimedia Commons
#21. McCracken County
– 2010 to 2020 population change: 2,658
— #803 among all counties nationwide
– 2010 to 2020 percent population change: +4.1%
— #37 among counties in Kentucky, #1,021 among all counties nationwide
– 2020 population: 67,875
— #12 largest county in Kentucky, #787 largest county nationwide
Nyttend // Wikimedia Commons
#20. Anderson County
– 2010 to 2020 population change: 2,772
— #795 among all counties nationwide
– 2010 to 2020 percent population change: +13.1%
— #10 among counties in Kentucky, #384 among all counties nationwide
– 2020 population: 23,852
— #49 largest county in Kentucky, #1,644 largest county nationwide
Nyttend // Wikimedia Commons
#19. Barren County
– 2010 to 2020 population change: 2,800
— #790 among all counties nationwide
– 2010 to 2020 percent population change: +6.7%
— #25 among counties in Kentucky, #790 among all counties nationwide
– 2020 population: 44,485
— #25 largest county in Kentucky, #1,086 largest county nationwide
Nyttend // Wikimedia Commons
#18. Spencer County
– 2010 to 2020 population change: 2,908
— #779 among all counties nationwide
– 2010 to 2020 percent population change: +17.5%
— #4 among counties in Kentucky, #245 among all counties nationwide
– 2020 population: 19,490
— #61 largest county in Kentucky, #1,849 largest county nationwide
Nyttend // Wikimedia Commons
#17. Pulaski County
– 2010 to 2020 population change: 2,972
— #769 among all counties nationwide
– 2010 to 2020 percent population change: +4.8%
— #33 among counties in Kentucky, #957 among all counties nationwide
– 2020 population: 65,034
— #14 largest county in Kentucky, #829 largest county nationwide
Rdikeman // Wikimedia Commons
#16. Campbell County
– 2010 to 2020 population change: 4,060
— #685 among all counties nationwide
– 2010 to 2020 percent population change: +4.6%
— #36 among counties in Kentucky, #978 among all counties nationwide
– 2020 population: 93,076
— #8 largest county in Kentucky, #645 largest county nationwide
Chris Light // Wikimedia Commons
#15. Nelson County
– 2010 to 2020 population change: 4,215
— #676 among all counties nationwide
– 2010 to 2020 percent population change: +9.9%
— #14 among counties in Kentucky, #565 among all counties nationwide
– 2020 population: 46,738
— #22 largest county in Kentucky, #1,038 largest county nationwide
W.marsh // Wikimedia Commons
#14. Laurel County
– 2010 to 2020 population change: 4,458
— #660 among all counties nationwide
– 2010 to 2020 percent population change: +7.7%
— #20 among counties in Kentucky, #720 among all counties nationwide
– 2020 population: 62,613
— #15 largest county in Kentucky, #851 largest county nationwide
Christopher L. Riley // Wikimedia Commons
#13. Jessamine County
– 2010 to 2020 population change: 5,918
— #590 among all counties nationwide
– 2010 to 2020 percent population change: +12.6%
— #11 among counties in Kentucky, #412 among all counties nationwide
– 2020 population: 52,991
— #18 largest county in Kentucky, #949 largest county nationwide
W.marsh // Wikimedia Commons
#12. Shelby County
– 2010 to 2020 population change: 7,166
— #546 among all counties nationwide
– 2010 to 2020 percent population change: +17.5%
— #5 among counties in Kentucky, #247 among all counties nationwide
– 2020 population: 48,065
— #21 largest county in Kentucky, #1,020 largest county nationwide
Farragutful // Wikimedia Commons
#11. Daviess County
– 2010 to 2020 population change: 7,914
— #530 among all counties nationwide
– 2010 to 2020 percent population change: +8.3%
— #19 among counties in Kentucky, #670 among all counties nationwide
– 2020 population: 103,312
— #7 largest county in Kentucky, #593 largest county nationwide
W.marsh // Wikimedia Commons
#10. Oldham County
– 2010 to 2020 population change: 8,823
— #503 among all counties nationwide
– 2010 to 2020 percent population change: +15.0%
— #6 among counties in Kentucky, #309 among all counties nationwide
– 2020 population: 67,607
— #13 largest county in Kentucky, #792 largest county nationwide
W.marsh // Wikimedia Commons
#9. Bullitt County
– 2010 to 2020 population change: 9,702
— #491 among all counties nationwide
– 2010 to 2020 percent population change: +13.4%
— #9 among counties in Kentucky, #372 among all counties nationwide
– 2020 population: 82,217
— #10 largest county in Kentucky, #695 largest county nationwide
Nyttend // Wikimedia Commons
#8. Hardin County
– 2010 to 2020 population change: 9,826
— #485 among all counties nationwide
– 2010 to 2020 percent population change: +9.7%
— #15 among counties in Kentucky, #576 among all counties nationwide
– 2020 population: 110,702
— #6 largest county in Kentucky, #554 largest county nationwide
Greg5030 // Wikimedia Commons
#7. Kenton County
– 2010 to 2020 population change: 11,030
— #454 among all counties nationwide
– 2010 to 2020 percent population change: +7.0%
— #23 among counties in Kentucky, #765 among all counties nationwide
– 2020 population: 169,064
— #3 largest county in Kentucky, #394 largest county nationwide
FloNight (Sydney Poore) and Russell Poore // Wikimedia Commons
#6. Madison County
– 2010 to 2020 population change: 11,121
— #452 among all counties nationwide
– 2010 to 2020 percent population change: +13.6%
— #8 among counties in Kentucky, #366 among all counties nationwide
– 2020 population: 92,701
— #9 largest county in Kentucky, #648 largest county nationwide
W.marsh // Wikimedia Commons
#5. Scott County
– 2010 to 2020 population change: 12,287
— #429 among all counties nationwide
– 2010 to 2020 percent population change: +27.4%
— #1 among counties in Kentucky, #91 among all counties nationwide
– 2020 population: 57,155
— #17 largest county in Kentucky, #911 largest county nationwide
W.marsh // Wikimedia Commons
#4. Boone County
– 2010 to 2020 population change: 21,245
— #319 among all counties nationwide
– 2010 to 2020 percent population change: +18.5%
— #3 among counties in Kentucky, #221 among all counties nationwide
– 2020 population: 135,968
— #4 largest county in Kentucky, #478 largest county nationwide
OPMaster // Wikimedia Commons
#3. Warren County
– 2010 to 2020 population change: 24,779
— #286 among all counties nationwide
– 2010 to 2020 percent population change: +22.6%
— #2 among counties in Kentucky, #144 among all counties nationwide
– 2020 population: 134,554
— #5 largest county in Kentucky, #481 largest county nationwide
Christopher L. Riley // Wikimedia Commons
#2. Fayette County
– 2010 to 2020 population change: 34,525
— #220 among all counties nationwide
– 2010 to 2020 percent population change: +12.0%
— #12 among counties in Kentucky, #440 among all counties nationwide
– 2020 population: 322,570
— #2 largest county in Kentucky, #223 largest county nationwide

Chris Watson // Wikicommons
#1. Jefferson County
– 2010 to 2020 population change: 53,517
— #144 among all counties nationwide
– 2010 to 2020 percent population change: +7.3%
— #21 among counties in Kentucky, #742 among all counties nationwide
– 2020 population: 782,969
— #1 largest county in Kentucky, #83 largest county nationwide


