Counties with the highest rate of food insecure children in Kentucky
Published 12:02 pm Friday, August 6, 2021
W.marsh // Wikimedia Commons
Counties with the highest rate of food insecure children in Kentucky
Food insecurity is a widespread problem in the United States, with people experiencing food insecurity in every single county in the nation. The nonprofit Feeding America describes food insecurity as “a lack of consistent access to enough food for every person in a household to live an active, healthy life.”
Food insecurity hits children particularly hard. The USDA estimates that more than 5.3 million children lived in food-insecure households in 2019. The COVID-19 pandemic put further strain on households already experiencing food hardship, with Feeding America estimating that 13 million children may experience food insecurity in 2021—that’s one in six children. Not having consistent access to enough food can affect cognitive abilities, overall health, moods, and attention spans—not to mention the psychological effects of living with scarcity.
Stacker compiled a list of counties in Kentucky with the highest rate of food insecure children using data from Feeding America. Counties are ranked by highest percent of children with food insecurity as of 2019.
You may also like: Best counties to raise a family in Kentucky
Brian Stansberry // Wikimedia Commons
#50. Christian County
– Child food insecurity rate: 21.2%
— Number of food insecure children: 4,090
– Percentage of children in households with income below 185% FPL: 74.0%
– Percentage of children in households with income above 185% FPL: 26.0%
– Overall food insecurity rate: 16.2%
Turover // Wikimedia Commons
#49. Greenup County
– Child food insecurity rate: 21.4%
— Number of food insecure children: 1,630
– Percentage of children in households with income below 185% FPL: 65.0%
– Percentage of children in households with income above 185% FPL: 36.0%
– Overall food insecurity rate: 15.6%
W.marsh // Wikimedia Commons
#48. Laurel County
– Child food insecurity rate: 21.5%
— Number of food insecure children: 3,000
– Percentage of children in households with income below 185% FPL: 82.0%
– Percentage of children in households with income above 185% FPL: 18.0%
– Overall food insecurity rate: 17.2%
Joel Bradshaw // Wikimedia Commons
#47. Ohio County
– Child food insecurity rate: 21.6%
— Number of food insecure children: 1,290
– Percentage of children in households with income below 185% FPL: 79.0%
– Percentage of children in households with income above 185% FPL: 22.0%
– Overall food insecurity rate: 15.4%
Nyttend // Wikimedia Commons
#46. Casey County
– Child food insecurity rate: 21.7%
— Number of food insecure children: 780
– Percentage of children in households with income below 185% FPL: 82.0%
– Percentage of children in households with income above 185% FPL: 18.0%
– Overall food insecurity rate: 17.7%
You may also like: Most valuable crops grown in Kentucky
Nyttend // Wikimedia Commons
#45. Powell County
– Child food insecurity rate: 21.8%
— Number of food insecure children: 650
– Percentage of children in households with income below 185% FPL: 82.0%
– Percentage of children in households with income above 185% FPL: 18.0%
– Overall food insecurity rate: 18.1%
Nyttend // Wikimedia Commons
#44. Martin County
– Child food insecurity rate: 22.0%
— Number of food insecure children: 510
– Percentage of children in households with income below 185% FPL: 80.0%
– Percentage of children in households with income above 185% FPL: 21.0%
– Overall food insecurity rate: 19.2%
Brian Stansberry // Wikimedia Commons
#43. Monroe County
– Child food insecurity rate: 22.0%
— Number of food insecure children: 530
– Percentage of children in households with income below 185% FPL: 80.0%
– Percentage of children in households with income above 185% FPL: 20.0%
– Overall food insecurity rate: 17.5%
Bedford // Wikimedia Commons
#42. Webster County
– Child food insecurity rate: 22.0%
— Number of food insecure children: 670
– Percentage of children in households with income below 185% FPL: 78.0%
– Percentage of children in households with income above 185% FPL: 22.0%
– Overall food insecurity rate: 17.4%
Wdzinc // Wikimedia Commons
#41. Marion County
– Child food insecurity rate: 22.0%
— Number of food insecure children: 1,030
– Percentage of children in households with income below 185% FPL: 77.0%
– Percentage of children in households with income above 185% FPL: 23.0%
– Overall food insecurity rate: 16.4%
You may also like: Highest-rated things to do in Kentucky, according to Tripadvisor
No machine-readable author provided. Blinutne assumed (based on copyright claims). // Wikimedia Commons
#40. Whitley County
– Child food insecurity rate: 22.1%
— Number of food insecure children: 2,000
– Percentage of children in households with income below 185% FPL: 87.0%
– Percentage of children in households with income above 185% FPL: 13.0%
– Overall food insecurity rate: 18.5%
Nyttend // Wikimedia Commons
#39. Lyon County
– Child food insecurity rate: 22.4%
— Number of food insecure children: 260
– Percentage of children in households with income below 185% FPL: 78.0%
– Percentage of children in households with income above 185% FPL: 22.0%
– Overall food insecurity rate: 15.1%
w:User:Malepheasant // Wikimedia Commons
#38. Boyd County
– Child food insecurity rate: 22.5%
— Number of food insecure children: 2,280
– Percentage of children in households with income below 185% FPL: 70.0%
– Percentage of children in households with income above 185% FPL: 30.0%
– Overall food insecurity rate: 17.0%
W.marsh // Wikimedia Commons
#37. Bath County
– Child food insecurity rate: 22.8%
— Number of food insecure children: 730
– Percentage of children in households with income below 185% FPL: 97.0%
– Percentage of children in households with income above 185% FPL: 3.0%
– Overall food insecurity rate: 18.1%
Nyttend // Wikimedia Commons
#36. Metcalfe County
– Child food insecurity rate: 23.0%
— Number of food insecure children: 530
– Percentage of children in households with income below 185% FPL: 90.0%
– Percentage of children in households with income above 185% FPL: 10.0%
– Overall food insecurity rate: 17.6%
You may also like: Lowest-earning counties in Kentucky
Smceuen // Wikimedia Commons
#35. Carroll County
– Child food insecurity rate: 23.0%
— Number of food insecure children: 630
– Percentage of children in households with income below 185% FPL: 67.0%
– Percentage of children in households with income above 185% FPL: 33.0%
– Overall food insecurity rate: 16.1%
HiB2Bornot2B // Wikimedia Commons
#34. Johnson County
– Child food insecurity rate: 23.0%
— Number of food insecure children: 1,170
– Percentage of children in households with income below 185% FPL: 66.0%
– Percentage of children in households with income above 185% FPL: 34.0%
– Overall food insecurity rate: 19.7%
FloNight (Sydney Poore) and Russell Poore // Wikimedia Commons
#33. Fleming County
– Child food insecurity rate: 23.1%
— Number of food insecure children: 820
– Percentage of children in households with income below 185% FPL: 81.0%
– Percentage of children in households with income above 185% FPL: 19.0%
– Overall food insecurity rate: 17.1%
Nyttend // Wikimedia Commons
#32. Clinton County
– Child food insecurity rate: 23.2%
— Number of food insecure children: 540
– Percentage of children in households with income below 185% FPL: 100.0%
– Percentage of children in households with income above 185% FPL: 0.0%
– Overall food insecurity rate: 18.4%
Nyttend // Wikimedia Commons
#31. Barren County
– Child food insecurity rate: 23.2%
— Number of food insecure children: 2,430
– Percentage of children in households with income below 185% FPL: 79.0%
– Percentage of children in households with income above 185% FPL: 21.0%
– Overall food insecurity rate: 17.6%
You may also like: Highest-rated specialty museums in Kentucky, according to Tripadvisor
W.marsh // Wikimedia Commons
#30. Rowan County
– Child food insecurity rate: 23.5%
— Number of food insecure children: 1,090
– Percentage of children in households with income below 185% FPL: 83.0%
– Percentage of children in households with income above 185% FPL: 17.0%
– Overall food insecurity rate: 18.8%
Nyttend // Wikimedia Commons
#29. Morgan County
– Child food insecurity rate: 23.6%
— Number of food insecure children: 580
– Percentage of children in households with income below 185% FPL: 79.0%
– Percentage of children in households with income above 185% FPL: 21.0%
– Overall food insecurity rate: 18.3%
Huw Williams (Huwmanbeing) // Wikimedia Commons
#28. Grayson County
– Child food insecurity rate: 24.0%
— Number of food insecure children: 1,500
– Percentage of children in households with income below 185% FPL: 84.0%
– Percentage of children in households with income above 185% FPL: 16.0%
– Overall food insecurity rate: 18.0%
JERRYE & ROY KLOTZ MD // Wikimedia Commons
#27. Wayne County
– Child food insecurity rate: 25.2%
— Number of food insecure children: 1,090
– Percentage of children in households with income below 185% FPL: 76.0%
– Percentage of children in households with income above 185% FPL: 24.0%
– Overall food insecurity rate: 18.5%
CoryClaxon // Wikimedia Commons
#26. Carter County
– Child food insecurity rate: 25.5%
— Number of food insecure children: 1,540
– Percentage of children in households with income below 185% FPL: 77.0%
– Percentage of children in households with income above 185% FPL: 23.0%
– Overall food insecurity rate: 19.6%
You may also like: Counties with the most veterans in Kentucky
Nyttend // Wikimedia Commons
#25. Lawrence County
– Child food insecurity rate: 25.6%
— Number of food insecure children: 960
– Percentage of children in households with income below 185% FPL: 87.0%
– Percentage of children in households with income above 185% FPL: 13.0%
– Overall food insecurity rate: 20.2%
C. Bedford Crenshaw // Wikimedia Commons
#24. Lewis County
– Child food insecurity rate: 25.8%
— Number of food insecure children: 770
– Percentage of children in households with income below 185% FPL: 97.0%
– Percentage of children in households with income above 185% FPL: 3.0%
– Overall food insecurity rate: 20.3%
Nyttend // Wikimedia Commons
#23. Knox County
– Child food insecurity rate: 26.0%
— Number of food insecure children: 1,910
– Percentage of children in households with income below 185% FPL: 88.0%
– Percentage of children in households with income above 185% FPL: 12.0%
– Overall food insecurity rate: 20.9%
Nyttend // Wikimedia Commons
#22. Perry County
– Child food insecurity rate: 26.2%
— Number of food insecure children: 1,560
– Percentage of children in households with income below 185% FPL: 81.0%
– Percentage of children in households with income above 185% FPL: 19.0%
– Overall food insecurity rate: 20.8%
Nyttend // Wikimedia Commons
#21. Pike County
– Child food insecurity rate: 26.2%
— Number of food insecure children: 3,220
– Percentage of children in households with income below 185% FPL: 80.0%
– Percentage of children in households with income above 185% FPL: 20.0%
– Overall food insecurity rate: 19.7%
You may also like: States sending the most people to Kentucky
W.marsh // Wikimedia Commons
#20. Robertson County
– Child food insecurity rate: 26.7%
— Number of food insecure children: 140
– Percentage of children in households with income below 185% FPL: 50.0%
– Percentage of children in households with income above 185% FPL: 51.0%
– Overall food insecurity rate: 17.8%
Nyttend // Wikimedia Commons
#19. Menifee County
– Child food insecurity rate: 27.1%
— Number of food insecure children: 370
– Percentage of children in households with income below 185% FPL: 79.0%
– Percentage of children in households with income above 185% FPL: 22.0%
– Overall food insecurity rate: 18.7%
Nyttend // Wikimedia Commons
#18. Estill County
– Child food insecurity rate: 27.8%
— Number of food insecure children: 850
– Percentage of children in households with income below 185% FPL: 79.0%
– Percentage of children in households with income above 185% FPL: 21.0%
– Overall food insecurity rate: 21.5%
Kybluegrass // Wikimedia Commons
#17. McCreary County
– Child food insecurity rate: 27.9%
— Number of food insecure children: 1,100
– Percentage of children in households with income below 185% FPL: 95.0%
– Percentage of children in households with income above 185% FPL: 5.0%
– Overall food insecurity rate: 21.8%
Nyttend // Wikimedia Commons
#16. Nicholas County
– Child food insecurity rate: 28.0%
— Number of food insecure children: 480
– Percentage of children in households with income below 185% FPL: 85.0%
– Percentage of children in households with income above 185% FPL: 15.0%
– Overall food insecurity rate: 19.9%
You may also like: Best counties to retire to in Kentucky
JERRYE & ROY KLOTZ MD // Wikimedia Commons
#15. Owsley County
– Child food insecurity rate: 28.6%
— Number of food insecure children: 260
– Percentage of children in households with income below 185% FPL: 75.0%
– Percentage of children in households with income above 185% FPL: 25.0%
– Overall food insecurity rate: 23.4%
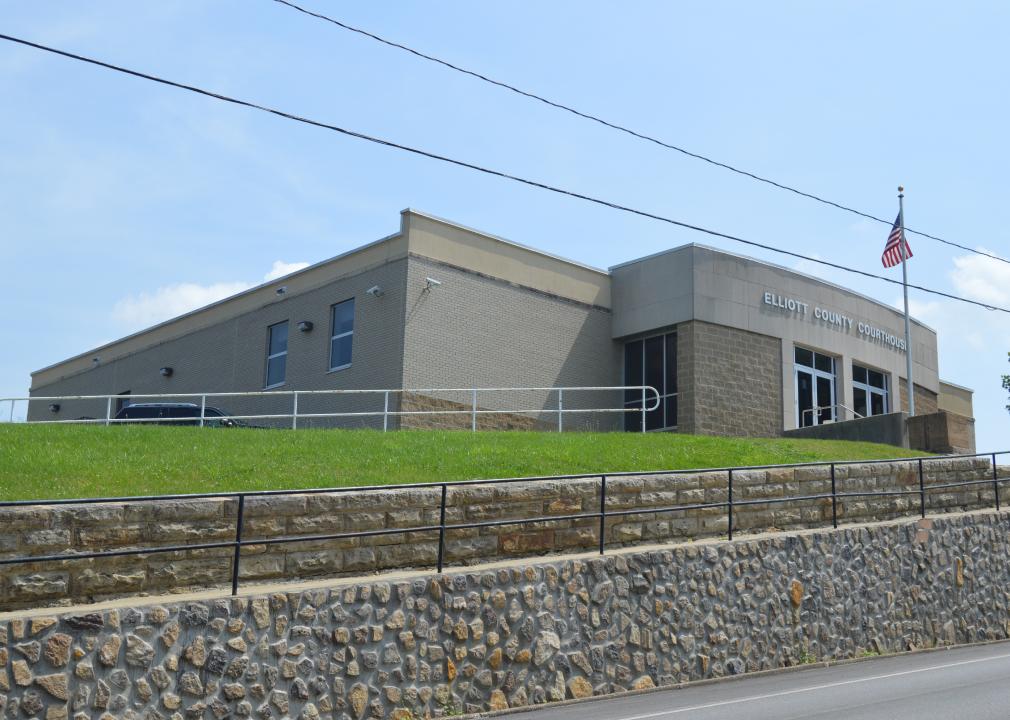
Nyttend // Wikimedia Commons
#14. Elliott County
– Child food insecurity rate: 28.9%
— Number of food insecure children: 400
– Percentage of children in households with income below 185% FPL: 76.0%
– Percentage of children in households with income above 185% FPL: 24.0%
– Overall food insecurity rate: 22.4%
W.marsh // Wikimedia Commons
#13. Jackson County
– Child food insecurity rate: 28.9%
— Number of food insecure children: 870
– Percentage of children in households with income below 185% FPL: 75.0%
– Percentage of children in households with income above 185% FPL: 25.0%
– Overall food insecurity rate: 22.7%
Nyttend // Wikimedia Commons
#12. Floyd County
– Child food insecurity rate: 29.0%
— Number of food insecure children: 2,280
– Percentage of children in households with income below 185% FPL: 76.0%
– Percentage of children in households with income above 185% FPL: 24.0%
– Overall food insecurity rate: 22.4%
Calvin Beale // Wikimedia Commons
#11. Fulton County
– Child food insecurity rate: 29.6%
— Number of food insecure children: 400
– Percentage of children in households with income below 185% FPL: 67.0%
– Percentage of children in households with income above 185% FPL: 33.0%
– Overall food insecurity rate: 19.4%
You may also like: Fastest-growing counties in Kentucky
Nyttend // Wikimedia Commons
#10. Wolfe County
– Child food insecurity rate: 29.6%
— Number of food insecure children: 490
– Percentage of children in households with income below 185% FPL: 83.0%
– Percentage of children in households with income above 185% FPL: 17.0%
– Overall food insecurity rate: 24.8%
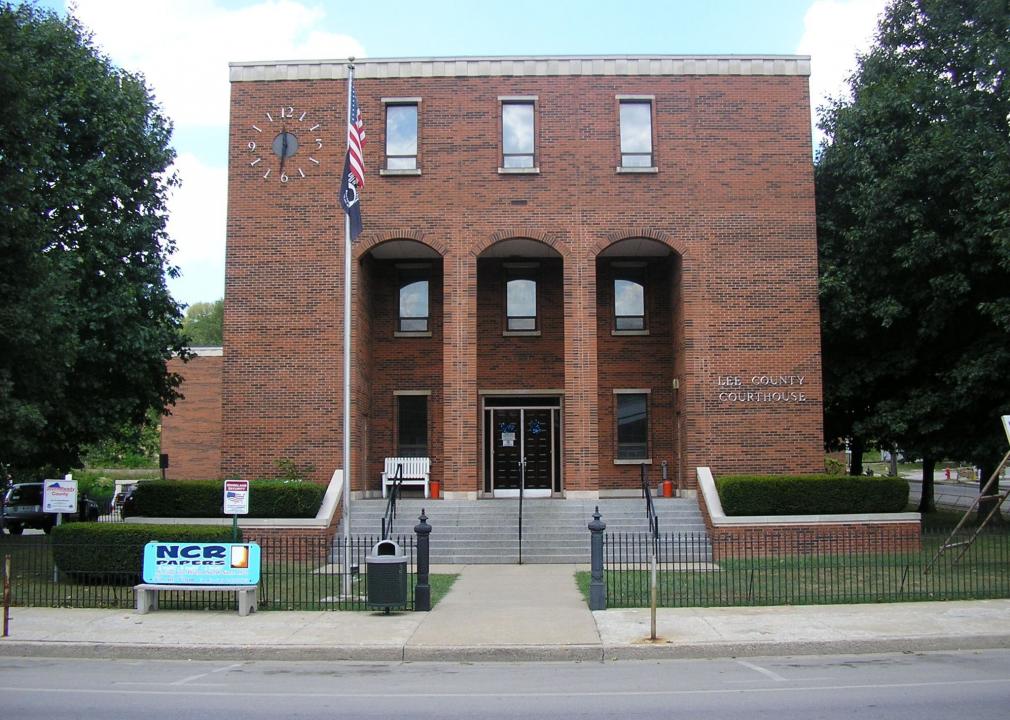
W.marsh // Wikimedia Commons
#9. Lee County
– Child food insecurity rate: 30.5%
— Number of food insecure children: 430
– Percentage of children in households with income below 185% FPL: 89.0%
– Percentage of children in households with income above 185% FPL: 12.0%
– Overall food insecurity rate: 23.8%
Nyttend // Wikimedia Commons
#8. Knott County
– Child food insecurity rate: 31.7%
— Number of food insecure children: 970
– Percentage of children in households with income below 185% FPL: 97.0%
– Percentage of children in households with income above 185% FPL: 3.0%
– Overall food insecurity rate: 23.1%
Nyttend // Wikimedia Commons
#7. Bell County
– Child food insecurity rate: 31.7%
— Number of food insecure children: 1,810
– Percentage of children in households with income below 185% FPL: 82.0%
– Percentage of children in households with income above 185% FPL: 18.0%
– Overall food insecurity rate: 24.8%
Nyttend // Wikimedia Commons
#6. Clay County
– Child food insecurity rate: 31.8%
— Number of food insecure children: 1,380
– Percentage of children in households with income below 185% FPL: 82.0%
– Percentage of children in households with income above 185% FPL: 18.0%
– Overall food insecurity rate: 24.7%
You may also like: Counties with the oldest homes in Kentucky
Nyttend // Wikimedia Commons
#5. Letcher County
– Child food insecurity rate: 32.2%
— Number of food insecure children: 1,550
– Percentage of children in households with income below 185% FPL: 78.0%
– Percentage of children in households with income above 185% FPL: 22.0%
– Overall food insecurity rate: 24.0%
Nyttend // Wikimedia Commons
#4. Breathitt County
– Child food insecurity rate: 32.7%
— Number of food insecure children: 860
– Percentage of children in households with income below 185% FPL: 82.0%
– Percentage of children in households with income above 185% FPL: 18.0%
– Overall food insecurity rate: 25.3%
Nyttend // Wikimedia Commons
#3. Magoffin County
– Child food insecurity rate: 32.8%
— Number of food insecure children: 940
– Percentage of children in households with income below 185% FPL: 90.0%
– Percentage of children in households with income above 185% FPL: 10.0%
– Overall food insecurity rate: 24.8%
Nyttend // Wikimedia Commons
#2. Leslie County
– Child food insecurity rate: 33.2%
— Number of food insecure children: 730
– Percentage of children in households with income below 185% FPL: 70.0%
– Percentage of children in households with income above 185% FPL: 30.0%
– Overall food insecurity rate: 25.9%
W.marsh // Wikimedia Commons
#1. Harlan County
– Child food insecurity rate: 35.1%
— Number of food insecure children: 2,150
– Percentage of children in households with income below 185% FPL: 85.0%
– Percentage of children in households with income above 185% FPL: 16.0%
– Overall food insecurity rate: 26.6%
You may also like: Counties with the worst commutes in Kentucky


