Think you know which Kentucky counties are the most diverse in the state? Find out.
Published 11:47 am Tuesday, June 15, 2021
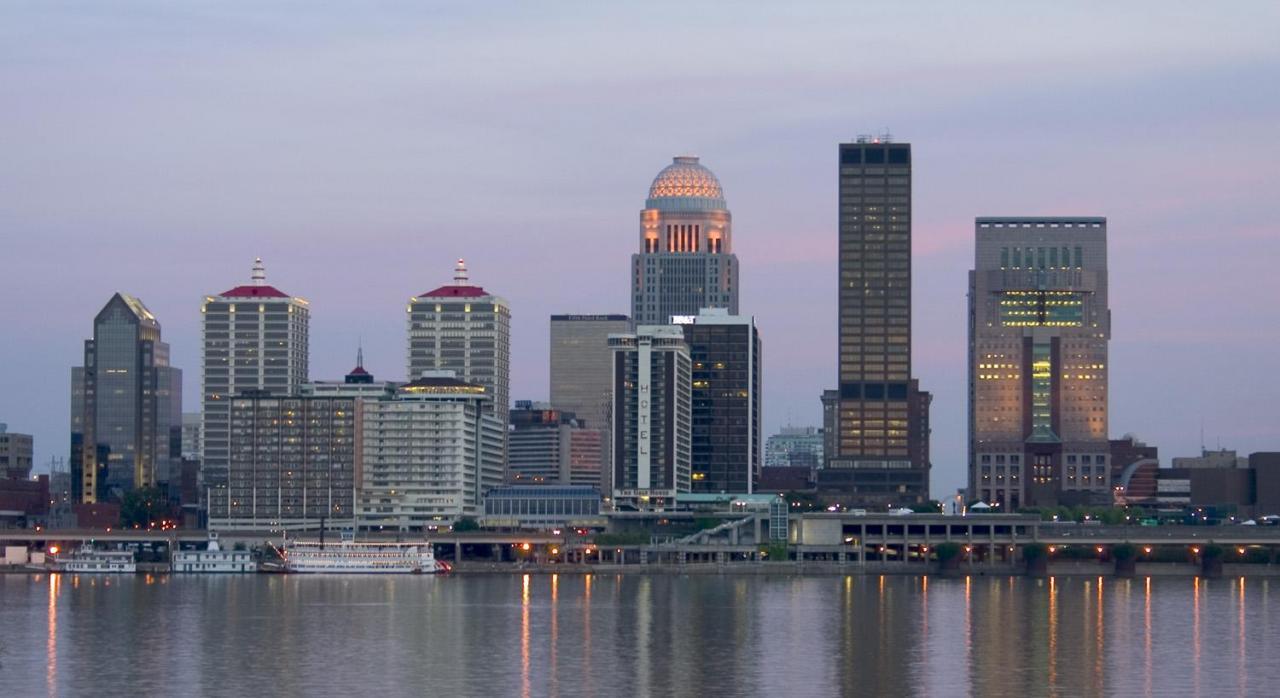
Chris Watson // Wikicommons
Most diverse counties in Kentucky
The United States has a longstanding reputation as being a melting pot (or salad bowl), with its diversity manifesting itself across many different demographics. However, some places across the country are notably more heterogeneous than others.
Stacker compiled a list of the most diverse counties in Kentucky using data from using data from the U.S. Census Bureau. Counties are ranked by the highest Simpson’s diversity index score. Simpson’s diversity index measures community diversity on a scale of 0 (least diverse) to 1 (most diverse), more on the calculation can be read here.
Think you know which counties in your home state might be the most diverse? Keep reading to see if your predictions are correct.
You may also like: Highest-rated things to do in Kentucky, according to Tripadvisor

Nyttend // Wikimedia Commons
#50. Henry County
– Index: 0.128
– Total population: 15,911
– White: 93.3% (14,844)
– Black or African American: 3.0% (472)
– American Indian and Alaska Native: 0.0% (0)
– Asian: 0.6% (100)
– Native Hawaiian and other Pacific Islander: 0.1% (19)
– 2 or more races: 1.8% (289)
– Some other Race: 1.2% (187)
C. Bedford Crenshaw // Wikimedia Commons
#49. Caldwell County
– Index: 0.131
– Total population: 12,702
– White: 93.0% (11,813)
– Black or African American: 6.3% (796)
– American Indian and Alaska Native: 0.0% (0)
– Asian: 0.0% (0)
– Native Hawaiian and other Pacific Islander: 0.0% (0)
– 2 or more races: 0.7% (93)
– Some other Race: 0.0% (0)
Nyttend // Wikimedia Commons
#48. Martin County
– Index: 0.131
– Total population: 11,648
– White: 93.0% (10,837)
– Black or African American: 5.5% (636)
– American Indian and Alaska Native: 0.2% (29)
– Asian: 0.1% (11)
– Native Hawaiian and other Pacific Islander: 0.1% (12)
– 2 or more races: 0.7% (78)
– Some other Race: 0.4% (45)
Nyttend // Wikimedia Commons
#47. Mercer County
– Index: 0.133
– Total population: 21,592
– White: 93.0% (20,078)
– Black or African American: 4.2% (909)
– American Indian and Alaska Native: 0.1% (31)
– Asian: 0.5% (98)
– Native Hawaiian and other Pacific Islander: 0.1% (12)
– 2 or more races: 1.6% (343)
– Some other Race: 0.6% (121)
Nyttend // Wikimedia Commons
#46. Gallatin County
– Index: 0.134
– Total population: 8,737
– White: 92.9% (8,121)
– Black or African American: 2.0% (176)
– American Indian and Alaska Native: 0.0% (0)
– Asian: 0.1% (6)
– Native Hawaiian and other Pacific Islander: 0.0% (0)
– 2 or more races: 1.8% (160)
– Some other Race: 3.1% (274)
You may also like: Highest-rated Class of 2021 football recruits from Kentucky

W.marsh // Wikimedia Commons
#45. Larue County
– Index: 0.136
– Total population: 14,204
– White: 92.8% (13,186)
– Black or African American: 3.5% (503)
– American Indian and Alaska Native: 0.1% (10)
– Asian: 0.4% (53)
– Native Hawaiian and other Pacific Islander: 0.0% (0)
– 2 or more races: 1.6% (224)
– Some other Race: 1.6% (228)
Jonathunder // Wikimedia Commons
#44. Ballard County
– Index: 0.137
– Total population: 8,032
– White: 92.8% (7,452)
– Black or African American: 4.1% (328)
– American Indian and Alaska Native: 0.6% (48)
– Asian: 0.2% (19)
– Native Hawaiian and other Pacific Islander: 0.0% (0)
– 2 or more races: 2.2% (176)
– Some other Race: 0.1% (9)
Nyttend // Wikimedia Commons
#43. Cumberland County
– Index: 0.137
– Total population: 6,697
– White: 92.8% (6,216)
– Black or African American: 2.1% (140)
– American Indian and Alaska Native: 0.0% (0)
– Asian: 0.8% (51)
– Native Hawaiian and other Pacific Islander: 0.0% (0)
– 2 or more races: 2.1% (142)
– Some other Race: 2.2% (148)
Nyttend // Wikimedia Commons
#42. Barren County
– Index: 0.137
– Total population: 43,884
– White: 92.8% (40,712)
– Black or African American: 3.5% (1,547)
– American Indian and Alaska Native: 0.1% (54)
– Asian: 0.3% (148)
– Native Hawaiian and other Pacific Islander: 0.0% (0)
– 2 or more races: 2.9% (1,273)
– Some other Race: 0.3% (150)
Megangen1990 // Wikimedia Commons
#41. Muhlenberg County
– Index: 0.138
– Total population: 30,951
– White: 92.7% (28,689)
– Black or African American: 4.5% (1,404)
– American Indian and Alaska Native: 0.2% (54)
– Asian: 0.8% (243)
– Native Hawaiian and other Pacific Islander: 0.1% (22)
– 2 or more races: 1.5% (471)
– Some other Race: 0.2% (68)
You may also like: Highest-rated specialty museums in Kentucky, according to Tripadvisor

Christopher L. Riley // Wikimedia Commons
#40. Clark County
– Index: 0.141
– Total population: 35,971
– White: 92.6% (33,297)
– Black or African American: 4.7% (1,674)
– American Indian and Alaska Native: 0.2% (54)
– Asian: 0.6% (221)
– Native Hawaiian and other Pacific Islander: 0.0% (0)
– 2 or more races: 1.6% (576)
– Some other Race: 0.4% (149)
Smceuen // Wikimedia Commons
#39. Carroll County
– Index: 0.156
– Total population: 10,671
– White: 91.8% (9,793)
– Black or African American: 3.2% (340)
– American Indian and Alaska Native: 0.3% (34)
– Asian: 0.3% (35)
– Native Hawaiian and other Pacific Islander: 0.0% (0)
– 2 or more races: 1.1% (120)
– Some other Race: 3.3% (349)
Nyttend // Wikimedia Commons
#38. Meade County
– Index: 0.156
– Total population: 28,182
– White: 91.8% (25,861)
– Black or African American: 3.8% (1,061)
– American Indian and Alaska Native: 0.7% (211)
– Asian: 0.7% (185)
– Native Hawaiian and other Pacific Islander: 0.0% (0)
– 2 or more races: 2.5% (702)
– Some other Race: 0.6% (162)
Nyttend // Wikimedia Commons
#37. Lyon County
– Index: 0.157
– Total population: 8,271
– White: 91.6% (7,580)
– Black or African American: 5.7% (474)
– American Indian and Alaska Native: 0.6% (50)
– Asian: 0.4% (31)
– Native Hawaiian and other Pacific Islander: 0.1% (12)
– 2 or more races: 1.3% (109)
– Some other Race: 0.2% (15)
W.marsh // Wikimedia Commons
#36. Woodford County
– Index: 0.157
– Total population: 26,318
– White: 91.6% (24,118)
– Black or African American: 4.5% (1,196)
– American Indian and Alaska Native: 0.0% (0)
– Asian: 0.4% (107)
– Native Hawaiian and other Pacific Islander: 0.0% (0)
– 2 or more races: 2.5% (646)
– Some other Race: 1.0% (251)
You may also like: Counties with the oldest homes in Kentucky

Chris Light // Wikimedia Commons
#35. Nelson County
– Index: 0.161
– Total population: 45,650
– White: 91.4% (41,726)
– Black or African American: 5.1% (2,341)
– American Indian and Alaska Native: 0.1% (47)
– Asian: 0.5% (247)
– Native Hawaiian and other Pacific Islander: 0.0% (0)
– 2 or more races: 1.9% (880)
– Some other Race: 0.9% (409)
Murray State // Wikimedia Commons
#34. Calloway County
– Index: 0.162
– Total population: 38,837
– White: 91.4% (35,515)
– Black or African American: 3.5% (1,369)
– American Indian and Alaska Native: 0.3% (125)
– Asian: 1.1% (426)
– Native Hawaiian and other Pacific Islander: 0.2% (89)
– 2 or more races: 2.9% (1,136)
– Some other Race: 0.5% (177)
W.marsh // Wikimedia Commons
#33. Oldham County
– Index: 0.162
– Total population: 65,967
– White: 91.4% (60,313)
– Black or African American: 3.7% (2,437)
– American Indian and Alaska Native: 0.2% (134)
– Asian: 1.6% (1,028)
– Native Hawaiian and other Pacific Islander: 0.0% (29)
– 2 or more races: 2.6% (1,690)
– Some other Race: 0.5% (336)
FloNight (Sydney Poore) and Russell Poore // Wikimedia Commons
#32. Madison County
– Index: 0.163
– Total population: 90,802
– White: 91.4% (82,952)
– Black or African American: 4.1% (3,728)
– American Indian and Alaska Native: 0.4% (344)
– Asian: 0.9% (808)
– Native Hawaiian and other Pacific Islander: 0.3% (251)
– 2 or more races: 2.4% (2,206)
– Some other Race: 0.6% (513)
Nyttend // Wikimedia Commons
#31. Taylor County
– Index: 0.163
– Total population: 25,571
– White: 91.3% (23,349)
– Black or African American: 4.3% (1,095)
– American Indian and Alaska Native: 0.1% (21)
– Asian: 1.1% (273)
– Native Hawaiian and other Pacific Islander: 0.0% (0)
– 2 or more races: 3.0% (778)
– Some other Race: 0.2% (55)
You may also like: Fastest-growing counties in Kentucky

Christopher L. Riley // Wikimedia Commons
#30. Jessamine County
– Index: 0.163
– Total population: 53,032
– White: 91.3% (48,430)
– Black or African American: 4.6% (2,445)
– American Indian and Alaska Native: 0.3% (156)
– Asian: 1.4% (766)
– Native Hawaiian and other Pacific Islander: 0.0% (11)
– 2 or more races: 1.7% (878)
– Some other Race: 0.7% (346)
Bedford // Wikimedia Commons
#29. Webster County
– Index: 0.169
– Total population: 13,068
– White: 91.0% (11,891)
– Black or African American: 3.6% (474)
– American Indian and Alaska Native: 0.1% (12)
– Asian: 0.1% (7)
– Native Hawaiian and other Pacific Islander: 0.1% (9)
– 2 or more races: 3.3% (432)
– Some other Race: 1.9% (243)
Bedford // Wikimedia Commons
#28. Logan County
– Index: 0.173
– Total population: 26,902
– White: 90.7% (24,400)
– Black or African American: 6.7% (1,806)
– American Indian and Alaska Native: 0.1% (17)
– Asian: 0.3% (69)
– Native Hawaiian and other Pacific Islander: 0.0% (2)
– 2 or more races: 1.6% (429)
– Some other Race: 0.7% (179)
W.marsh // Wikimedia Commons
#27. Boone County
– Index: 0.174
– Total population: 130,820
– White: 90.7% (118,715)
– Black or African American: 2.9% (3,815)
– American Indian and Alaska Native: 0.1% (126)
– Asian: 2.4% (3,137)
– Native Hawaiian and other Pacific Islander: 0.0% (0)
– 2 or more races: 2.4% (3,186)
– Some other Race: 1.4% (1,841)
Greg5030 // Wikimedia Commons
#26. Mason County
– Index: 0.175
– Total population: 17,112
– White: 90.6% (15,505)
– Black or African American: 6.3% (1,082)
– American Indian and Alaska Native: 0.0% (8)
– Asian: 0.9% (155)
– Native Hawaiian and other Pacific Islander: 0.0% (7)
– 2 or more races: 1.8% (309)
– Some other Race: 0.3% (46)
You may also like: Biggest sources of immigrants to Kentucky

Dcoetzee // Wikimedia Commons
#25. Trigg County
– Index: 0.177
– Total population: 14,449
– White: 90.4% (13,062)
– Black or African American: 7.4% (1,076)
– American Indian and Alaska Native: 0.0% (0)
– Asian: 0.5% (68)
– Native Hawaiian and other Pacific Islander: 0.0% (0)
– 2 or more races: 1.3% (193)
– Some other Race: 0.3% (50)
W.marsh // Wikimedia Commons
#24. Bourbon County
– Index: 0.178
– Total population: 20,058
– White: 90.4% (18,128)
– Black or African American: 7.0% (1,401)
– American Indian and Alaska Native: 0.0% (0)
– Asian: 0.8% (162)
– Native Hawaiian and other Pacific Islander: 0.0% (0)
– 2 or more races: 0.4% (88)
– Some other Race: 1.4% (279)
Wdzinc // Wikimedia Commons
#23. Marion County
– Index: 0.182
– Total population: 19,244
– White: 90.2% (17,349)
– Black or African American: 7.3% (1,408)
– American Indian and Alaska Native: 0.2% (36)
– Asian: 0.2% (41)
– Native Hawaiian and other Pacific Islander: 0.1% (28)
– 2 or more races: 1.7% (329)
– Some other Race: 0.3% (53)
Farragutful // Wikimedia Commons
#22. Daviess County
– Index: 0.183
– Total population: 100,474
– White: 90.2% (90,657)
– Black or African American: 4.4% (4,372)
– American Indian and Alaska Native: 0.2% (169)
– Asian: 1.8% (1,767)
– Native Hawaiian and other Pacific Islander: 0.3% (253)
– 2 or more races: 2.6% (2,644)
– Some other Race: 0.6% (612)
Kybluegrass // Wikimedia Commons
#21. McCreary County
– Index: 0.185
– Total population: 17,465
– White: 90.1% (15,732)
– Black or African American: 5.7% (989)
– American Indian and Alaska Native: 0.7% (118)
– Asian: 0.5% (79)
– Native Hawaiian and other Pacific Islander: 0.0% (5)
– 2 or more races: 2.6% (452)
– Some other Race: 0.5% (90)
You may also like: Best counties to raise a family in Kentucky

Greg5030 // Wikimedia Commons
#20. Kenton County
– Index: 0.185
– Total population: 165,668
– White: 90.1% (149,303)
– Black or African American: 4.6% (7,640)
– American Indian and Alaska Native: 0.1% (213)
– Asian: 1.3% (2,108)
– Native Hawaiian and other Pacific Islander: 0.0% (37)
– 2 or more races: 2.5% (4,074)
– Some other Race: 1.4% (2,293)
Jim.henderson // Wikimedia Commons
#19. Hopkins County
– Index: 0.185
– Total population: 45,331
– White: 90.0% (40,802)
– Black or African American: 6.4% (2,916)
– American Indian and Alaska Native: 0.2% (90)
– Asian: 0.6% (269)
– Native Hawaiian and other Pacific Islander: 0.0% (6)
– 2 or more races: 2.4% (1,082)
– Some other Race: 0.4% (166)
Brian Stansberry // Wikimedia Commons
#18. Washington County
– Index: 0.185
– Total population: 12,023
– White: 90.1% (10,828)
– Black or African American: 5.4% (644)
– American Indian and Alaska Native: 0.0% (0)
– Asian: 0.9% (106)
– Native Hawaiian and other Pacific Islander: 0.0% (0)
– 2 or more races: 2.4% (288)
– Some other Race: 1.3% (157)
Paul Sableman // Wikimedia Commons
#17. Graves County
– Index: 0.194
– Total population: 37,248
– White: 89.6% (33,366)
– Black or African American: 4.5% (1,662)
– American Indian and Alaska Native: 0.1% (52)
– Asian: 0.5% (169)
– Native Hawaiian and other Pacific Islander: 0.3% (111)
– 2 or more races: 2.6% (975)
– Some other Race: 2.5% (913)
w.marsh // Wikimedia Commons
#16. Henderson County
– Index: 0.219
– Total population: 45,829
– White: 88.0% (40,333)
– Black or African American: 7.3% (3,345)
– American Indian and Alaska Native: 0.2% (93)
– Asian: 0.4% (194)
– Native Hawaiian and other Pacific Islander: 0.0% (12)
– 2 or more races: 2.9% (1,342)
– Some other Race: 1.1% (510)
You may also like: Counties with the most super commuters in Kentucky

W.marsh // Wikimedia Commons
#15. Scott County
– Index: 0.225
– Total population: 54,667
– White: 87.8% (48,003)
– Black or African American: 4.6% (2,528)
– American Indian and Alaska Native: 0.2% (133)
– Asian: 1.2% (650)
– Native Hawaiian and other Pacific Islander: 0.0% (0)
– 2 or more races: 3.3% (1,820)
– Some other Race: 2.8% (1,533)
Christopher L. Riley // Wikimedia Commons
#14. Boyle County
– Index: 0.227
– Total population: 29,972
– White: 87.5% (26,229)
– Black or African American: 8.0% (2,388)
– American Indian and Alaska Native: 0.3% (91)
– Asian: 0.9% (264)
– Native Hawaiian and other Pacific Islander: 0.0% (0)
– 2 or more races: 2.2% (647)
– Some other Race: 1.2% (353)
Acdixon // Wikimedia Commons
#13. Todd County
– Index: 0.227
– Total population: 12,316
– White: 87.5% (10,771)
– Black or African American: 8.2% (1,012)
– American Indian and Alaska Native: 0.0% (0)
– Asian: 0.1% (8)
– Native Hawaiian and other Pacific Islander: 0.0% (0)
– 2 or more races: 1.6% (202)
– Some other Race: 2.6% (323)
W.marsh // Wikimedia Commons
#12. Shelby County
– Index: 0.237
– Total population: 47,325
– White: 87.0% (41,165)
– Black or African American: 6.9% (3,244)
– American Indian and Alaska Native: 0.0% (0)
– Asian: 0.9% (439)
– Native Hawaiian and other Pacific Islander: 0.1% (37)
– 2 or more races: 2.7% (1,292)
– Some other Race: 2.4% (1,148)
Brian Stansberry // Wikimedia Commons
#11. Hickman County
– Index: 0.239
– Total population: 4,510
– White: 86.8% (3,913)
– Black or African American: 8.4% (377)
– American Indian and Alaska Native: 0.4% (18)
– Asian: 0.7% (32)
– Native Hawaiian and other Pacific Islander: 0.0% (0)
– 2 or more races: 3.3% (150)
– Some other Race: 0.4% (20)
You may also like: States sending the most people to Kentucky

Bfreas // Wikimedia Commons
#10. Simpson County
– Index: 0.254
– Total population: 18,183
– White: 85.7% (15,583)
– Black or African American: 10.3% (1,867)
– American Indian and Alaska Native: 0.4% (74)
– Asian: 0.7% (121)
– Native Hawaiian and other Pacific Islander: 0.0% (0)
– 2 or more races: 2.2% (404)
– Some other Race: 0.7% (134)
Smallbones // Wikimedia Commons
#9. McCracken County
– Index: 0.265
– Total population: 65,268
– White: 85.1% (55,515)
– Black or African American: 10.5% (6,843)
– American Indian and Alaska Native: 0.4% (272)
– Asian: 0.9% (573)
– Native Hawaiian and other Pacific Islander: 0.1% (46)
– 2 or more races: 2.5% (1,610)
– Some other Race: 0.6% (409)
Patricia Drury // Wikimedia Commons
#8. Union County
– Index: 0.289
– Total population: 14,638
– White: 83.2% (12,178)
– Black or African American: 13.3% (1,950)
– American Indian and Alaska Native: 0.0% (0)
– Asian: 0.5% (68)
– Native Hawaiian and other Pacific Islander: 0.0% (0)
– 2 or more races: 2.5% (367)
– Some other Race: 0.5% (75)
JERRYE & ROY KLOTZ MD // Wikimedia Commons
#7. Franklin County
– Index: 0.309
– Total population: 50,529
– White: 82.4% (41,652)
– Black or African American: 9.4% (4,729)
– American Indian and Alaska Native: 0.1% (54)
– Asian: 1.8% (915)
– Native Hawaiian and other Pacific Islander: 0.1% (36)
– 2 or more races: 3.9% (1,946)
– Some other Race: 2.4% (1,197)
OPMaster // Wikimedia Commons
#6. Warren County
– Index: 0.323
– Total population: 128,652
– White: 81.6% (104,990)
– Black or African American: 8.9% (11,459)
– American Indian and Alaska Native: 0.3% (438)
– Asian: 4.0% (5,151)
– Native Hawaiian and other Pacific Islander: 0.4% (477)
– 2 or more races: 2.9% (3,775)
– Some other Race: 1.8% (2,362)
You may also like: Counties with the worst commutes in Kentucky

Nyttend // Wikimedia Commons
#5. Hardin County
– Index: 0.354
– Total population: 108,527
– White: 79.4% (86,124)
– Black or African American: 11.6% (12,569)
– American Indian and Alaska Native: 0.2% (227)
– Asian: 2.2% (2,364)
– Native Hawaiian and other Pacific Islander: 0.3% (365)
– 2 or more races: 5.2% (5,638)
– Some other Race: 1.1% (1,240)
Christopher L. Riley // Wikimedia Commons
#4. Fayette County
– Index: 0.415
– Total population: 320,601
– White: 74.9% (239,996)
– Black or African American: 14.6% (46,844)
– American Indian and Alaska Native: 0.2% (608)
– Asian: 3.8% (12,028)
– Native Hawaiian and other Pacific Islander: 0.0% (83)
– 2 or more races: 3.8% (12,027)
– Some other Race: 2.8% (9,015)
Calvin Beale // Wikimedia Commons
#3. Fulton County
– Index: 0.424
– Total population: 6,130
– White: 71.9% (4,410)
– Black or African American: 24.0% (1,472)
– American Indian and Alaska Native: 0.7% (43)
– Asian: 0.1% (9)
– Native Hawaiian and other Pacific Islander: 0.0% (0)
– 2 or more races: 2.6% (161)
– Some other Race: 0.6% (35)
Chris Watson // Wikicommons
#2. Jefferson County
– Index: 0.438
– Total population: 767,419
– White: 71.6% (549,506)
– Black or African American: 21.7% (166,794)
– American Indian and Alaska Native: 0.2% (1,403)
– Asian: 2.9% (22,040)
– Native Hawaiian and other Pacific Islander: 0.1% (385)
– 2 or more races: 2.5% (19,497)
– Some other Race: 1.0% (7,794)
Brian Stansberry // Wikimedia Commons
#1. Christian County
– Index: 0.443
– Total population: 71,414
– White: 71.2% (50,879)
– Black or African American: 22.0% (15,683)
– American Indian and Alaska Native: 0.8% (543)
– Asian: 1.6% (1,167)
– Native Hawaiian and other Pacific Islander: 0.5% (338)
– 2 or more races: 3.0% (2,126)
– Some other Race: 0.9% (678)
You may also like: Best places to retire in Kentucky