Most rural counties in Kentucky
Published 12:40 pm Thursday, June 10, 2021
W.marsh // Wikimedia Commons
Most rural counties in Kentucky
A surprising number of U.S. counties have 100% rural land-702, in fact. Stacker compiled a list of the most rural counties in Kentucky using data from the U.S. Census Bureau. Counties are ranked by the percent of land area that is rural, as of the 2010 Census, with ties broken by residents per square mile, according to 2019 5-year population estimates.
According to the Census Bureau, rural land encompasses any land that isn’t an urban area. To be considered an urban area, a place has to have a densely settled core of census tracts or blocks and count at least 2,500 people, at least 1,500 of whom must be residents of non-institutional buildings. Areas with 50,000 people or more are considered urbanized areas, while areas with between 2,500 and 50,000 people are considered urban clusters.
You may also like: Highest-rated specialty museums in Kentucky, according to Tripadvisor

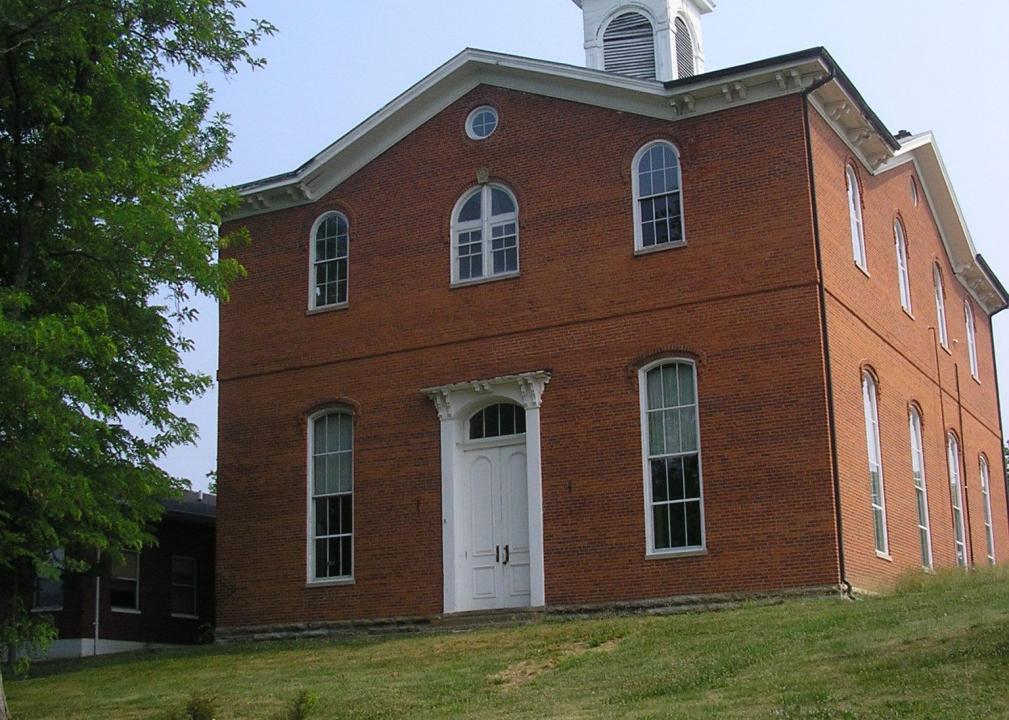
Nyttend // Wikimedia Commons
#50. Lawrence County
– Rural area: 99.4% (413 square miles)
– Urban area: 0.6% (3 square miles)
– Total land area: 416 square miles
— #29 largest county in state, #2,431 nationwide
– Population density: 37.7 people / square mile (15,671 residents)
— #29 lowest density county in state, #1,410 nationwide

FloNight (Sydney Poore) and Russell Poore // Wikimedia Commons
#49. Fleming County
– Rural area: 99.4% (347 square miles)
– Urban area: 0.6% (2 square miles)
– Total land area: 349 square miles
— #45 largest county in state, #2,682 nationwide
– Population density: 41.6 people / square mile (14,513 residents)
— #40 lowest density county in state, #1,509 nationwide

Ryan Emmick // Wikimedia Commons
#48. Hancock County
– Rural area: 99.5% (187 square miles)
– Urban area: 0.6% (1 square miles)
– Total land area: 188 square miles
— #108 largest county in state, #3,014 nationwide
– Population density: 46.5 people / square mile (8,720 residents)
— #47 lowest density county in state, #1,617 nationwide

Dcoetzee // Wikimedia Commons
#47. Trigg County
– Rural area: 99.5% (439 square miles)
– Urban area: 0.5% (2 square miles)
– Total land area: 441 square miles
— #21 largest county in state, #2,301 nationwide
– Population density: 32.7 people / square mile (14,449 residents)
— #19 lowest density county in state, #1,288 nationwide

Nyttend // Wikimedia Commons
#46. Trimble County
– Rural area: 99.5% (151 square miles)
– Urban area: 0.5% (1 square miles)
– Total land area: 152 square miles
— #116 largest county in state, #3,056 nationwide
– Population density: 56.4 people / square mile (8,558 residents)
— #59 lowest density county in state, #1,797 nationwide
You may also like: Fastest-growing counties in Kentucky

JERRYE & ROY KLOTZ MD // Wikimedia Commons
#45. Hart County
– Rural area: 99.5% (410 square miles)
– Urban area: 0.5% (2 square miles)
– Total land area: 412 square miles
— #30 largest county in state, #2,453 nationwide
– Population density: 45.4 people / square mile (18,729 residents)
— #46 lowest density county in state, #1,591 nationwide

Nyttend // Wikimedia Commons
#44. Crittenden County
– Rural area: 99.5% (358 square miles)
– Urban area: 0.5% (2 square miles)
– Total land area: 360 square miles
— #41 largest county in state, #2,654 nationwide
– Population density: 25.0 people / square mile (9,000 residents)
— #5 lowest density county in state, #1,063 nationwide

Nyttend // Wikimedia Commons
#43. Breathitt County
– Rural area: 99.6% (490 square miles)
– Urban area: 0.4% (2 square miles)
– Total land area: 492 square miles
— #12 largest county in state, #2,111 nationwide
– Population density: 26.4 people / square mile (12,977 residents)
— #8 lowest density county in state, #1,106 nationwide

Nyttend // Wikimedia Commons
#42. Livingston County
– Rural area: 99.8% (312 square miles)
– Urban area: 0.2% (1 square miles)
– Total land area: 313 square miles
— #58 largest county in state, #2,777 nationwide
– Population density: 29.5 people / square mile (9,235 residents)
— #10 lowest density county in state, #1,195 nationwide

Nyttend // Wikimedia Commons
#41. Spencer County
– Rural area: 100.0% (187 square miles)
– Urban area: 0.0% (0 square miles)
– Total land area: 187 square miles
— #110 largest county in state, #3,016 nationwide
– Population density: 100.1 people / square mile (18,680 residents)
— #92 lowest density county in state, #2,251 nationwide
You may also like: Highest-earning counties in Kentucky

Nyttend // Wikimedia Commons
#40. Gallatin County
– Rural area: 100.0% (101 square miles)
– Urban area: 0.0% (0 square miles)
– Total land area: 101 square miles
— #119 largest county in state, #3,086 nationwide
– Population density: 86.3 people / square mile (8,737 residents)
— #81 lowest density county in state, #2,144 nationwide

Nyttend // Wikimedia Commons
#39. Russell County
– Rural area: 100.0% (254 square miles)
– Urban area: 0.0% (0 square miles)
– Total land area: 254 square miles
— #80 largest county in state, #2,899 nationwide
– Population density: 70.1 people / square mile (17,778 residents)
— #69 lowest density county in state, #1,981 nationwide

Nyttend // Wikimedia Commons
#38. Letcher County
– Rural area: 100.0% (338 square miles)
– Urban area: 0.0% (0 square miles)
– Total land area: 338 square miles
— #53 largest county in state, #2,717 nationwide
– Population density: 66.0 people / square mile (22,295 residents)
— #63 lowest density county in state, #1,924 nationwide

Nyttend // Wikimedia Commons
#37. Henry County
– Rural area: 100.0% (286 square miles)
– Urban area: 0.0% (0 square miles)
– Total land area: 286 square miles
— #69 largest county in state, #2,826 nationwide
– Population density: 55.6 people / square mile (15,911 residents)
— #56 lowest density county in state, #1,783 nationwide

W.marsh // Wikimedia Commons
#36. Pendleton County
– Rural area: 100.0% (277 square miles)
– Urban area: 0.0% (0 square miles)
– Total land area: 277 square miles
— #75 largest county in state, #2,852 nationwide
– Population density: 52.6 people / square mile (14,572 residents)
— #52 lowest density county in state, #1,732 nationwide
You may also like: Biggest sources of immigrants to Kentucky

Nyttend // Wikimedia Commons
#35. Clinton County
– Rural area: 100.0% (197 square miles)
– Urban area: 0.0% (0 square miles)
– Total land area: 197 square miles
— #104 largest county in state, #2,999 nationwide
– Population density: 51.7 people / square mile (10,193 residents)
— #51 lowest density county in state, #1,720 nationwide

Nyttend // Wikimedia Commons
#34. Martin County
– Rural area: 100.0% (230 square miles)
– Urban area: 0.0% (0 square miles)
– Total land area: 230 square miles
— #93 largest county in state, #2,951 nationwide
– Population density: 50.7 people / square mile (11,648 residents)
— #50 lowest density county in state, #1,705 nationwide

W.marsh // Wikimedia Commons
#33. Bath County
– Rural area: 100.0% (279 square miles)
– Urban area: 0.0% (0 square miles)
– Total land area: 279 square miles
— #74 largest county in state, #2,851 nationwide
– Population density: 44.3 people / square mile (12,355 residents)
— #44 lowest density county in state, #1,560 nationwide

Nyttend // Wikimedia Commons
#32. Knott County
– Rural area: 100.0% (352 square miles)
– Urban area: 0.0% (0 square miles)
– Total land area: 352 square miles
— #43 largest county in state, #2,676 nationwide
– Population density: 43.4 people / square mile (15,260 residents)
— #43 lowest density county in state, #1,543 nationwide

Kybluegrass // Wikimedia Commons
#31. McCreary County
– Rural area: 100.0% (427 square miles)
– Urban area: 0.0% (0 square miles)
– Total land area: 427 square miles
— #26 largest county in state, #2,377 nationwide
– Population density: 40.9 people / square mile (17,465 residents)
— #38 lowest density county in state, #1,492 nationwide
You may also like: Counties with the most college graduates in Kentucky

Nyttend // Wikimedia Commons
#30. Magoffin County
– Rural area: 100.0% (308 square miles)
– Urban area: 0.0% (0 square miles)
– Total land area: 308 square miles
— #59 largest county in state, #2,789 nationwide
– Population density: 40.5 people / square mile (12,491 residents)
— #37 lowest density county in state, #1,481 nationwide

Brian Stansberry // Wikimedia Commons
#29. Washington County
– Rural area: 100.0% (297 square miles)
– Urban area: 0.0% (0 square miles)
– Total land area: 297 square miles
— #65 largest county in state, #2,811 nationwide
– Population density: 40.4 people / square mile (12,023 residents)
— #36 lowest density county in state, #1,478 nationwide

Nyttend // Wikimedia Commons
#28. Bracken County
– Rural area: 100.0% (206 square miles)
– Urban area: 0.0% (0 square miles)
– Total land area: 206 square miles
— #98 largest county in state, #2,988 nationwide
– Population density: 40.4 people / square mile (8,305 residents)
— #35 lowest density county in state, #1,477 nationwide

Huw Williams (Huwmanbeing) // Wikimedia Commons
#27. Edmonson County
– Rural area: 100.0% (303 square miles)
– Urban area: 0.0% (0 square miles)
– Total land area: 303 square miles
— #63 largest county in state, #2,803 nationwide
– Population density: 40.1 people / square mile (12,138 residents)
— #34 lowest density county in state, #1,469 nationwide

Bedford // Wikimedia Commons
#26. Webster County
– Rural area: 100.0% (332 square miles)
– Urban area: 0.0% (0 square miles)
– Total land area: 332 square miles
— #55 largest county in state, #2,732 nationwide
– Population density: 39.4 people / square mile (13,068 residents)
— #33 lowest density county in state, #1,460 nationwide
You may also like: Best counties to raise a family in Kentucky

W.marsh // Wikimedia Commons
#25. Jackson County
– Rural area: 100.0% (345 square miles)
– Urban area: 0.0% (0 square miles)
– Total land area: 345 square miles
— #46 largest county in state, #2,690 nationwide
– Population density: 38.7 people / square mile (13,369 residents)
— #32 lowest density county in state, #1,444 nationwide

Nyttend // Wikimedia Commons
#24. Lyon County
– Rural area: 100.0% (214 square miles)
– Urban area: 0.0% (0 square miles)
– Total land area: 214 square miles
— #95 largest county in state, #2,975 nationwide
– Population density: 38.7 people / square mile (8,271 residents)
— #31 lowest density county in state, #1,441 nationwide

Nyttend // Wikimedia Commons
#23. Green County
– Rural area: 100.0% (286 square miles)
– Urban area: 0.0% (0 square miles)
– Total land area: 286 square miles
— #70 largest county in state, #2,827 nationwide
– Population density: 38.4 people / square mile (10,979 residents)
— #30 lowest density county in state, #1,435 nationwide

Nyttend // Wikimedia Commons
#22. McLean County
– Rural area: 100.0% (252 square miles)
– Urban area: 0.0% (0 square miles)
– Total land area: 252 square miles
— #82 largest county in state, #2,902 nationwide
– Population density: 36.8 people / square mile (9,283 residents)
— #27 lowest density county in state, #1,391 nationwide

Nyttend // Wikimedia Commons
#21. Nicholas County
– Rural area: 100.0% (195 square miles)
– Urban area: 0.0% (0 square miles)
– Total land area: 195 square miles
— #105 largest county in state, #3,003 nationwide
– Population density: 36.6 people / square mile (7,153 residents)
— #26 lowest density county in state, #1,385 nationwide
You may also like: Highest-rated Class of 2021 football recruits from Kentucky

Nyttend // Wikimedia Commons
#20. Casey County
– Rural area: 100.0% (444 square miles)
– Urban area: 0.0% (0 square miles)
– Total land area: 444 square miles
— #20 largest county in state, #2,289 nationwide
– Population density: 35.8 people / square mile (15,885 residents)
— #25 lowest density county in state, #1,362 nationwide

Hunter Hawley // Wikimedia Commons
#19. Breckinridge County
– Rural area: 100.0% (567 square miles)
– Urban area: 0.0% (0 square miles)
– Total land area: 567 square miles
— #6 largest county in state, #1,806 nationwide
– Population density: 35.6 people / square mile (20,176 residents)
— #24 lowest density county in state, #1,351 nationwide

Nyttend // Wikimedia Commons
#18. Morgan County
– Rural area: 100.0% (381 square miles)
– Urban area: 0.0% (0 square miles)
– Total land area: 381 square miles
— #37 largest county in state, #2,596 nationwide
– Population density: 34.9 people / square mile (13,288 residents)
— #23 lowest density county in state, #1,335 nationwide

Nyttend // Wikimedia Commons
#17. Metcalfe County
– Rural area: 100.0% (290 square miles)
– Urban area: 0.0% (0 square miles)
– Total land area: 290 square miles
— #68 largest county in state, #2,824 nationwide
– Population density: 34.6 people / square mile (10,036 residents)
— #22 lowest density county in state, #1,330 nationwide

W.marsh // Wikimedia Commons
#16. Lee County
– Rural area: 100.0% (209 square miles)
– Urban area: 0.0% (0 square miles)
– Total land area: 209 square miles
— #96 largest county in state, #2,985 nationwide
– Population density: 32.9 people / square mile (6,881 residents)
— #21 lowest density county in state, #1,292 nationwide
You may also like: Best places to retire in Kentucky

Acdixon // Wikimedia Commons
#15. Todd County
– Rural area: 100.0% (374 square miles)
– Urban area: 0.0% (0 square miles)
– Total land area: 374 square miles
— #40 largest county in state, #2,619 nationwide
– Population density: 32.9 people / square mile (12,316 residents)
— #20 lowest density county in state, #1,291 nationwide

Jonathunder // Wikimedia Commons
#14. Ballard County
– Rural area: 100.0% (247 square miles)
– Urban area: 0.0% (0 square miles)
– Total land area: 247 square miles
— #86 largest county in state, #2,920 nationwide
– Population density: 32.6 people / square mile (8,032 residents)
— #18 lowest density county in state, #1,286 nationwide

Nyttend // Wikimedia Commons
#13. Wolfe County
– Rural area: 100.0% (222 square miles)
– Urban area: 0.0% (0 square miles)
– Total land area: 222 square miles
— #94 largest county in state, #2,965 nationwide
– Population density: 32.4 people / square mile (7,207 residents)
— #17 lowest density county in state, #1,280 nationwide

Brian Stansberry // Wikimedia Commons
#12. Monroe County
– Rural area: 100.0% (329 square miles)
– Urban area: 0.0% (0 square miles)
– Total land area: 329 square miles
— #56 largest county in state, #2,737 nationwide
– Population density: 32.3 people / square mile (10,627 residents)
— #16 lowest density county in state, #1,277 nationwide

Nyttend // Wikimedia Commons
#11. Elliott County
– Rural area: 100.0% (234 square miles)
– Urban area: 0.0% (0 square miles)
– Total land area: 234 square miles
— #90 largest county in state, #2,938 nationwide
– Population density: 32.1 people / square mile (7,510 residents)
— #15 lowest density county in state, #1,274 nationwide
You may also like: Highest-rated things to do in Kentucky, according to Tripadvisor

Nyttend // Wikimedia Commons
#10. Menifee County
– Rural area: 100.0% (204 square miles)
– Urban area: 0.0% (0 square miles)
– Total land area: 204 square miles
— #100 largest county in state, #2,991 nationwide
– Population density: 31.6 people / square mile (6,443 residents)
— #14 lowest density county in state, #1,262 nationwide

W.marsh // Wikimedia Commons
#9. Owen County
– Rural area: 100.0% (351 square miles)
– Urban area: 0.0% (0 square miles)
– Total land area: 351 square miles
— #44 largest county in state, #2,677 nationwide
– Population density: 30.7 people / square mile (10,796 residents)
— #13 lowest density county in state, #1,229 nationwide

Brian Stansberry // Wikimedia Commons
#8. Butler County
– Rural area: 100.0% (426 square miles)
– Urban area: 0.0% (0 square miles)
– Total land area: 426 square miles
— #27 largest county in state, #2,383 nationwide
– Population density: 30.0 people / square mile (12,764 residents)
— #12 lowest density county in state, #1,207 nationwide

C. Bedford Crenshaw // Wikimedia Commons
#7. Lewis County
– Rural area: 100.0% (483 square miles)
– Urban area: 0.0% (0 square miles)
– Total land area: 483 square miles
— #14 largest county in state, #2,146 nationwide
– Population density: 27.8 people / square mile (13,417 residents)
— #9 lowest density county in state, #1,146 nationwide

Nyttend // Wikimedia Commons
#6. Leslie County
– Rural area: 100.0% (401 square miles)
– Urban area: 0.0% (0 square miles)
– Total land area: 401 square miles
— #33 largest county in state, #2,520 nationwide
– Population density: 25.7 people / square mile (10,283 residents)
— #7 lowest density county in state, #1,089 nationwide
You may also like: Where people in Kentucky are moving to most

Nyttend // Wikimedia Commons
#5. Carlisle County
– Rural area: 100.0% (189 square miles)
– Urban area: 0.0% (0 square miles)
– Total land area: 189 square miles
— #106 largest county in state, #3,012 nationwide
– Population density: 25.3 people / square mile (4,784 residents)
— #6 lowest density county in state, #1,074 nationwide

JERRYE & ROY KLOTZ MD // Wikimedia Commons
#4. Owsley County
– Rural area: 100.0% (197 square miles)
– Urban area: 0.0% (0 square miles)
– Total land area: 197 square miles
— #102 largest county in state, #2,997 nationwide
– Population density: 22.5 people / square mile (4,442 residents)
— #4 lowest density county in state, #976 nationwide

Nyttend // Wikimedia Commons
#3. Cumberland County
– Rural area: 100.0% (305 square miles)
– Urban area: 0.0% (0 square miles)
– Total land area: 305 square miles
— #62 largest county in state, #2,799 nationwide
– Population density: 21.9 people / square mile (6,697 residents)
— #3 lowest density county in state, #955 nationwide

W.marsh // Wikimedia Commons
#2. Robertson County
– Rural area: 100.0% (100 square miles)
– Urban area: 0.0% (0 square miles)
– Total land area: 100 square miles
— #120 largest county in state, #3,087 nationwide
– Population density: 21.2 people / square mile (2,123 residents)
— #2 lowest density county in state, #934 nationwide

Brian Stansberry // Wikimedia Commons
#1. Hickman County
– Rural area: 100.0% (242 square miles)
– Urban area: 0.0% (0 square miles)
– Total land area: 242 square miles
— #88 largest county in state, #2,924 nationwide
– Population density: 18.6 people / square mile (4,510 residents)
— #1 lowest density county in state, #842 nationwide
You may also like: Counties with the most super commuters in Kentucky